
State of Student Aid in Texas – 2019
Total U.S. Consumer Debt Balance and Mortgage Debt Balance in Trillions of Dollars, Over Time, 2003-2017
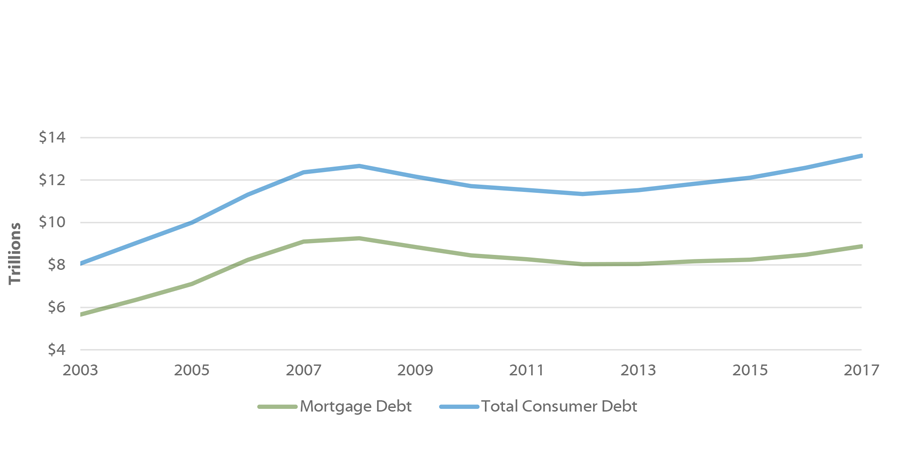
Total U.S consumer debt – including mortgage, credit card, student loan, auto, and other debt – reached more than $13.1 trillion in 2017. This is an increase of around $5.1 trillion since 2003. Mortgage debt is the largest form of consumer debt, at nearly $8.9 trillion in 2017. Debt spiked leading up to and during the economic recession a decade ago, but total consumer debt reached even higher levels than that in 2017.
U.S. Consumer Debt Balances in Trillions of Dollars (Non-Mortgage), Over Time, 2003-2017
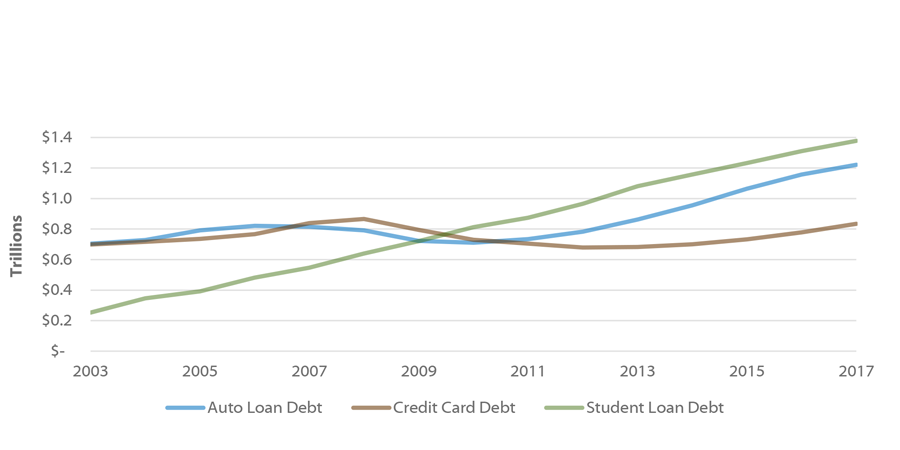
With a total of $1.38 trillion in 2017, student loan debt is the second largest form of consumer debt behind mortgages. It surpassed both auto and credit card debt in 2010 and has continued to rise. In fact, since 2003 student loan debt has increased by $1.1 trillion.
Sources: Federal Reserve Bank of New York, The Center for Microeconomic Data, Data & Reports, 2017 Q4 (https://www.newyorkfed.org/microeconomics/data.html).
U.S. Non-Mortgage Consumer Debt per Capita, 2003-2017
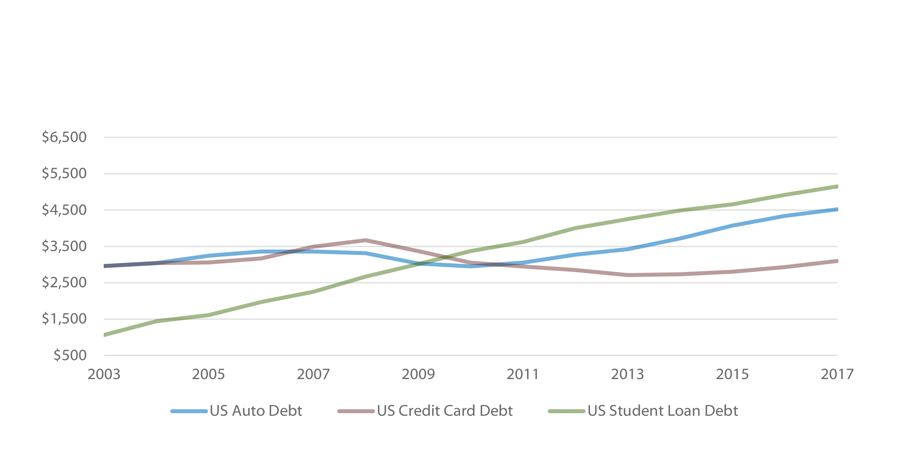
Mortgage debt is still the largest form consumer debt in the nation at $32,940 per capita in 2017. However, amongst the other forms of consumer debt, student loan debt became the second largest in 2010 – overtaking auto and credit debt – and has continued to rise.
Texas Non-Mortgage Consumer Debt per Capita, 2003-2017
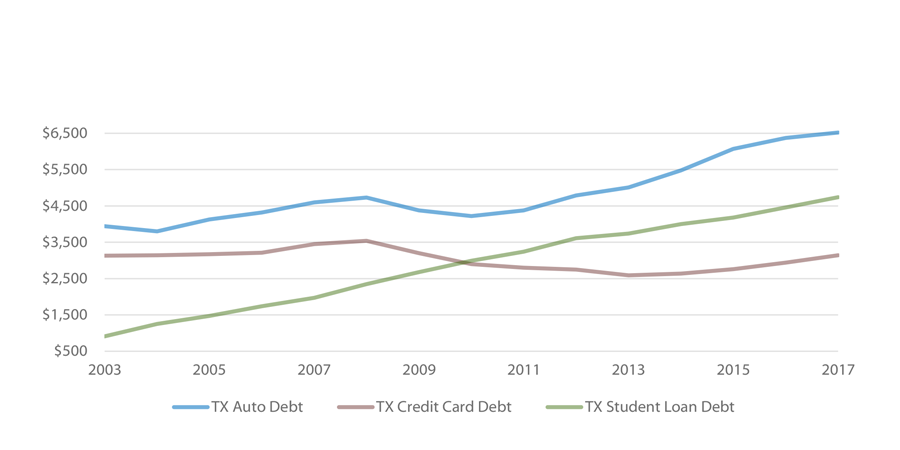
In Texas, mortgage debt is also the largest form of consumer debt, at $25,020 per capita in 2017. Amongst the other forms of consumer debt, student loans surpassed credit debt in 2010, but has not surpassed auto debt. Texas auto debt per capita in 2017 was $6,070.
Sources: Federal Reserve Bank of New York, The Center for Microeconomic Data, Data & Reports, 2017 Q4 (https://www.newyorkfed.org/microeconomics/data.html).
Student Loan Debt Balance per Capita by State
2017 Q4
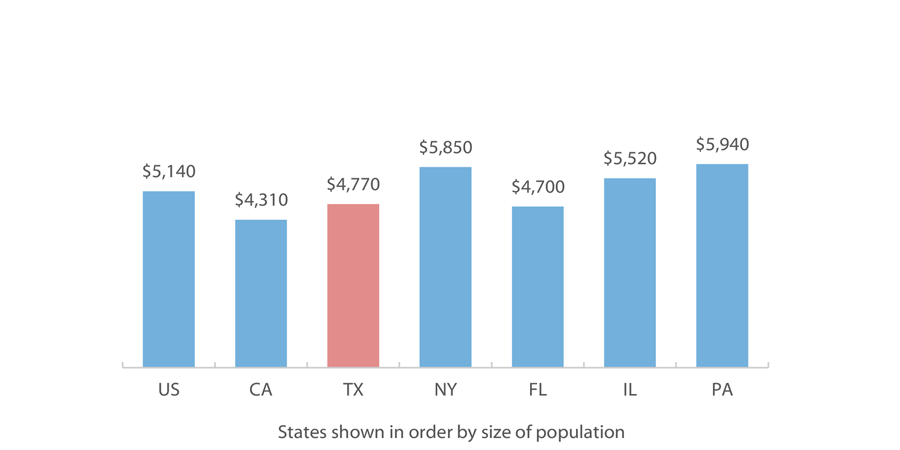
In the last quarter of 2017, Texans had a per capita student loan debt balance of about $4,770, lower than the national balance of $5,140. Texas has the third lowest student loan debt balance among the six largest states. Student loans in this analysis include loans to finance educational expenses provided by banks, credit unions and other financial institutions as well as federal and state governments.
Total Debt Balance per Capita by State
2017 Q4
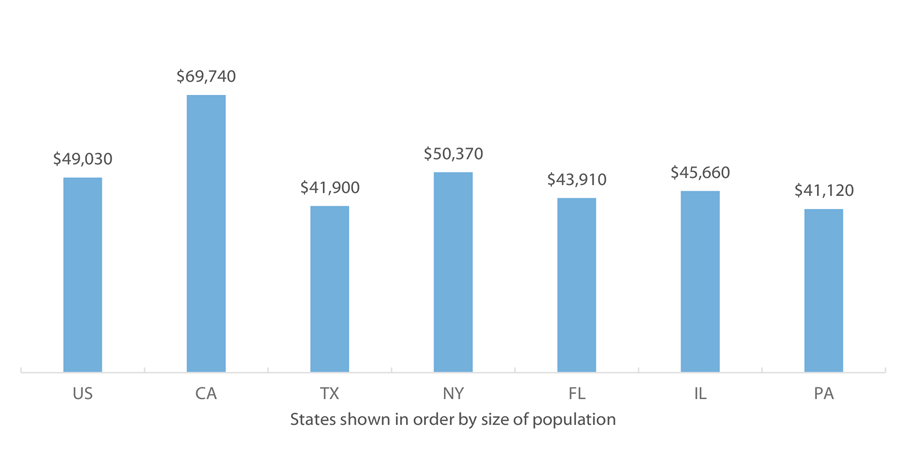
With a per capita average of $41,900 in debt, Texans have the second lowest debt balance among the six largest states and the national average. This debt profile includes mortgage accounts, home equity revolving accounts, auto loans, bankcard or credit card accounts, student loans, and other loans (such as consumer finance and retail loans).
Sources: Federal Reserve Bank of New York, The Center for Microeconomic Data, Data & Reports, 2017 Q4 (https://www.newyorkfed.org/microeconomics/data.html).
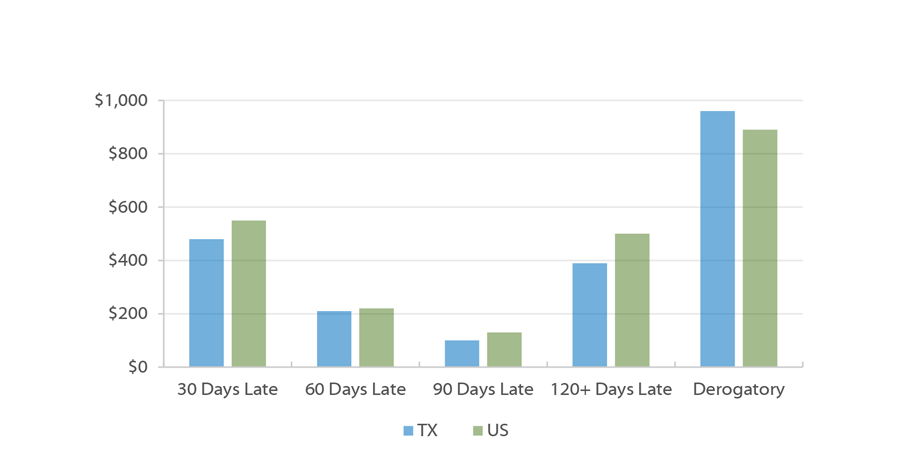
Delinquency Status of Debt per Capita by State
2017 Q4
Percentage of Balance 90+ Days Late by State
2017 and 2018
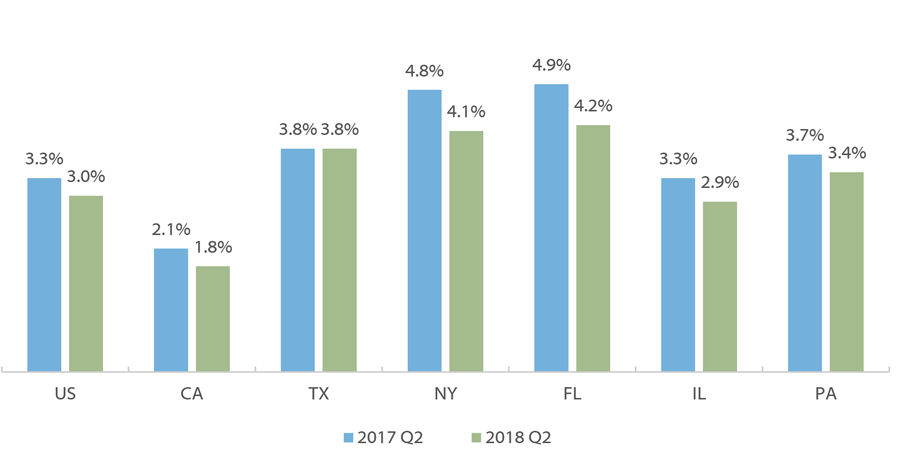
The amounts of debt in each stage of delinquency were not very different when comparing Texas and the US. Overall in the US and in most of the six largest states, the percentage of the debt balance that is severely delinquent – that is, 90 or more days late – had decreased by the second quarter of 2018 compared to the second quarter of 2017. Texas has the fourth highest percentage of severely delinquent borrowers among the six largest states, but still higher than the overall US percentage.
Note: The Derogatory delinquency status includes a person with any level of delinquency combined with repossession, charge off to bad debt, or foreclosure.
Sources: Federal Reserve Bank of New York, The Center for Microeconomic Data, Data & Reports, 2018 Q2 (https://www.newyorkfed.org/microeconomics/data.html).
Severe Delinquency for Student Loan Borrowers Surpassed Credit Cards in 2012 in Texas and the Nation
Percent of U.S. Consumer Debt Balance 90+ Days Delinquent, Over Time, 2003-2017
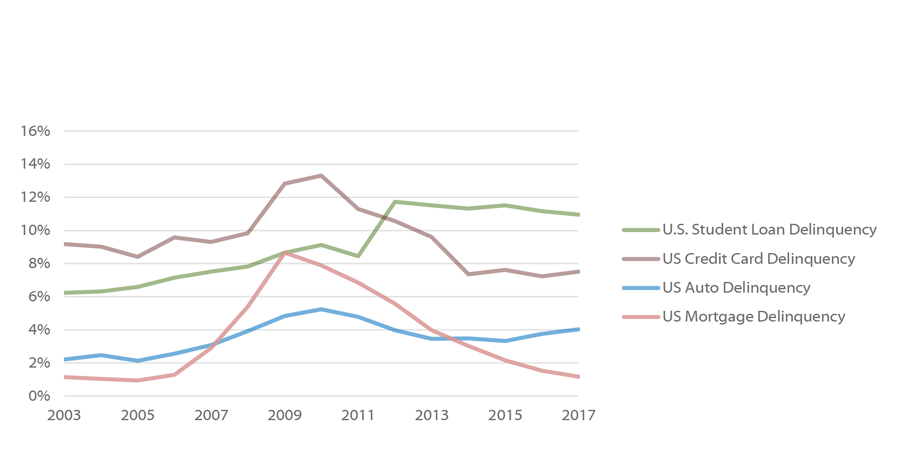
The percentage of debt that is severely delinquent – 90 or more days late – has shifted by debt type over time. Nationally, severe student loan debt delinquency overtook credit card delinquency in 2012 to have the highest percentage of severely delinquent borrowers. While severe mortgage debt delinquencies grew during the Great Recession, it fell below auto debt in 2014 and now has the lowest percentage of severely delinquent borrowers, at 1.2 percent in 2017.
Percent of Texas Consumer Debt Balance 90+ Days Delinquent, Over Time, 2003-2017
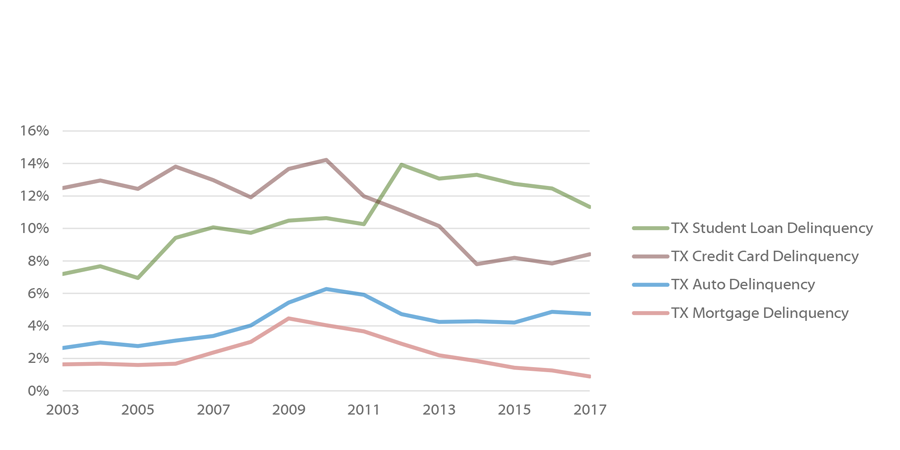
In Texas, severe student loan debt delinquency surpassed credit cards in 2012. In 2017, 11.3 percent of student loan borrowers and 8.4 percent of auto loan borrowers were 90 or more days delinquent. Unlike the nation, the percentage of severely delinquent mortgage borrowers never surpassed auto debt, even during the Great Recession.
Sources: Federal Reserve Bank of New York, The Center for Microeconomic Data, Data & Reports, 2017 Q4 (https://www.newyorkfed.org/microeconomics/data.html).
New 90+ Days Delinquent Loan Balances in Billions of Dollars (Non-Mortgage), Over Time, 2003-2016
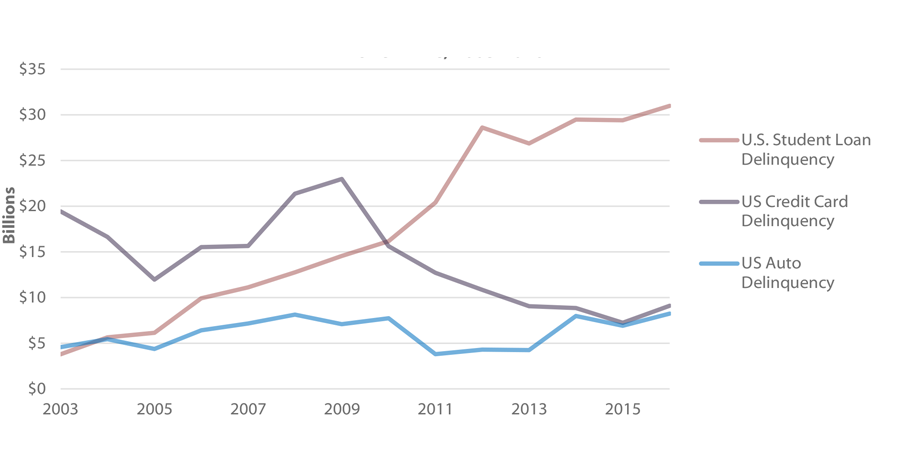
In pure dollar magnitude of new severe debt delinquency – 90 or more days late – mortgages have the largest balances at $45.8 billion in 2016. Amongst the other forms of consumer debt, the balances of student loan delinquency are far greater than auto and credit card debt. In 2016, new 90+ day student loan delinquencies totaled $31 billion, credit card delinquency totaled $9.1 billion, and auto debt delinquency was $8.2 billion.
Over time, the balances of severely delinquent accounts have shifted dramatically. In 2003, the balances for new, severely delinquent student loans were the lowest amongst the forms of consumer debt at $3.8 billion, lower than for auto loans ($4.6 billion in 2003). Since then there has been a substantial increase in the balance amount of new student loan delinquencies. In 2010, it surpassed credit card as the second highest severe delinquency balance after mortgages. Severe credit card delinquency balances have decreased from a high of $23 billion in 2009, to $9.1 billion in 2016.
Sources: Federal Reserve Bank of New York. Quarterly Report on Household Debt and Credit. (November 2018). The Center for Microeconomic Data, Data & Reports, (https://www.newyorkfed.org/microeconomics/data.html).
Percent of U.S. Non-Student Debt Balance 90+ Days Delinquent Among Student Loan Borrowers (2013)
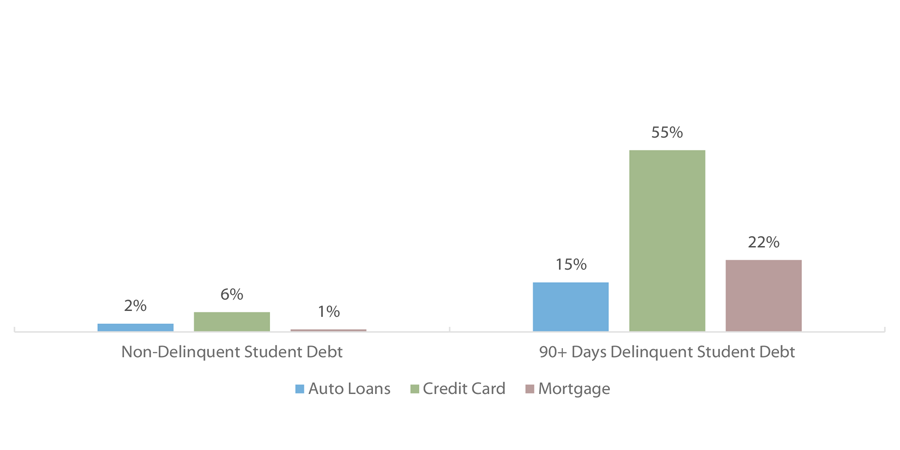
In a 2013 Federal Reserve Bank of New York analysis of student loan borrowing, researchers found that student loan borrowers that were severely delinquent – 90 or more days late – were also severely delinquent on other consumer debt at greater percentages compared to student loan borrowers who were not delinquent on their student loans. More than half of severely delinquent student loan borrowers (55 percent) were also severely delinquent on credit cards, 22 percent were delinquent on their mortgage, and 15 percent on auto loans.
Sources: Federal Reserve Bank of New York. Household Debt and Credit: Student Debt. (February 2013). The Center for Microeconomic Data, Data & Reports, (https://www.newyorkfed.org/microeconomics/data.html).
One Year Change in Student Loan Volume, by State
(July 2017 to July 2018)
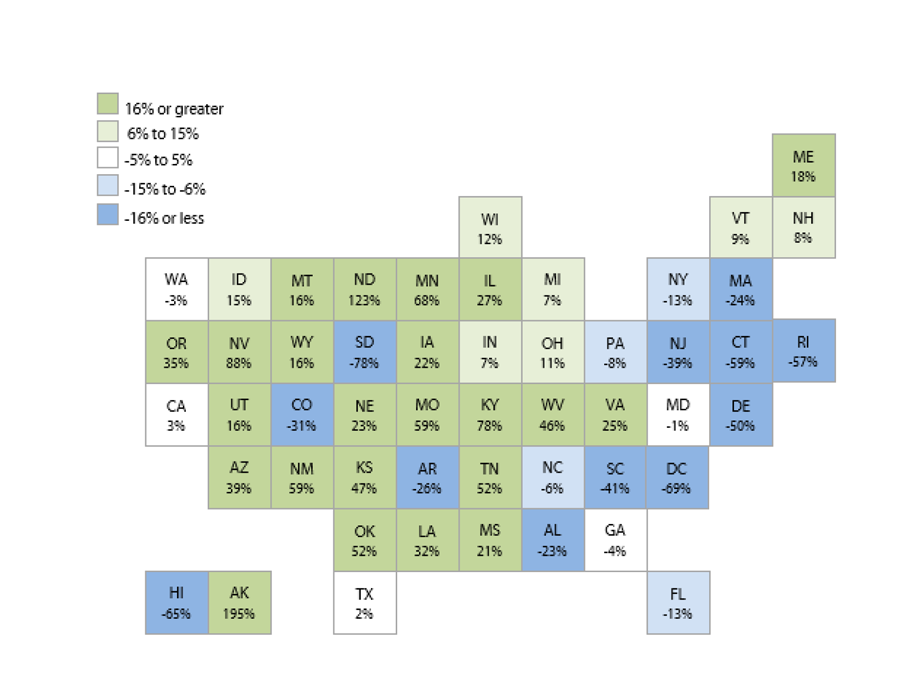
Between July 2017 and July 2018, almost two-thirds of U.S. states saw increases in the total volume of student loans. This ranged from nearly flat levels in Texas to an almost 200 percent increase in Alaska. The remaining states saw decreases ranging from a reduction of one percent in Maryland to a 78 percent lower volume in South Dakota.