
State of Student Aid in Texas – 2019
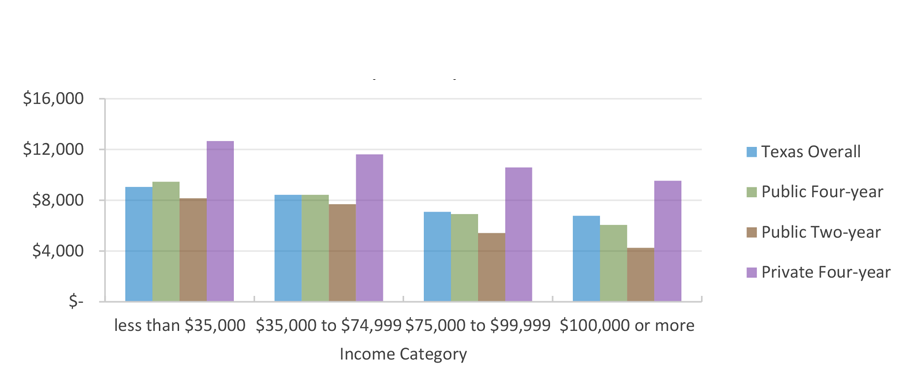
Average Unmet Need for Students in Texas by Income Category and Sector (Fall 2016)
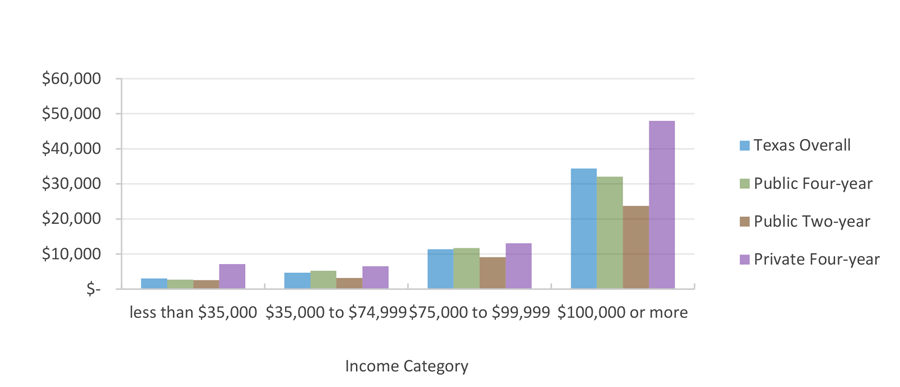
Average EFC for Students in Texas by Income Category and Sector (Fall 2016)
Unmet need is defined as a student’s cost of attendance* minus his or her expected family contribution (EFC)** and all financial aid including grants, scholarships, work-study, and loans. This is the amount that students and/or their families must cover over and above their EFC, which is also an out-of-pocket expense.
The lowest-income students in Texas tend to have the highest unmet need; in 2016, average unmet need for this group was about $9,057 statewide, or about $1,000 per month over the course of the 9-month school year. At private four-year schools, this group experienced average unmet need of over $12,000. Besides having greater financial resources to contribute to EFC, those in the highest income category are more likely to attend more expensive four-year institutions, which further increases EFC. Data on students who attended proprietary institutions are not available.
* Estimated sum of tuition and fees, books and supplies, food and housing, transportation, and other expenses for a full-time student for nine months.
** EFC is determined through a federal formula that considers family size, income, and the number of children in college, among other factors. It is considered a rough estimate of a reasonable, affordable annual payment for a family with a given set of circumstances.
Sources: Texas Higher Education Coordinating Board (THECB), “Unmet Need and Expected Family Contribution” (unpublished tables).
Average Unmet Need and Average EFC* by Race/Ethnicity for Texas Public Institutions (Fall 2016)
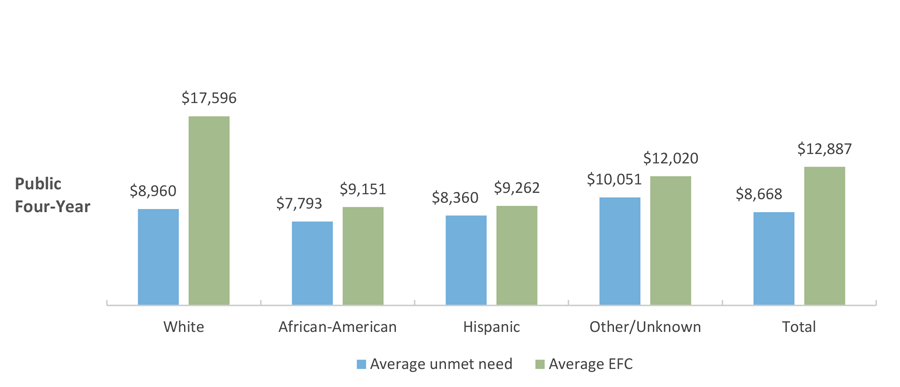
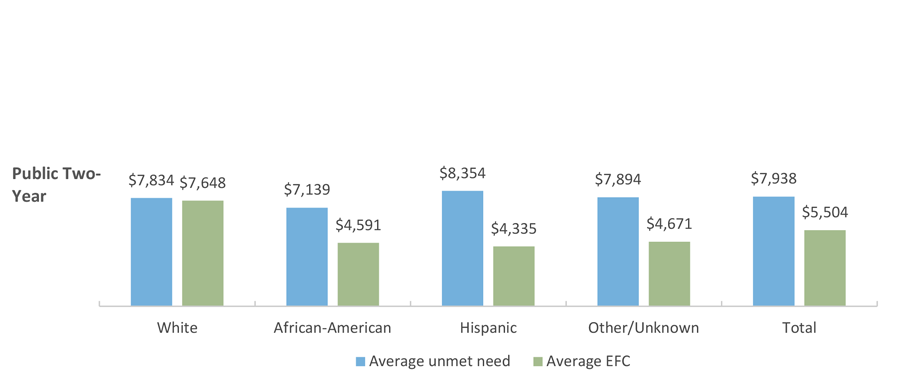
Despite substantially lower cost of attendance at public two-year schools, unmet need* is not significantly lower on average for students at these institutions compared to students at public four-year institutions. The average community college student had nearly $900 per month in unmet need over their 9-month school year.
For all racial/ethnic groups, average expected family contribution (EFC)** was much higher at four-year universities due to a higher cost of attendance and a larger concentration of students from higher income families. Higher income students are disproportionately White or in the “Other/unknown” category, which explains the higher EFC amounts for those racial/ethnic groups. This is particularly evident at public four-year schools, where students in these racial/ethnic groups are not only wealthier on average but also more likely to enroll at higher cost universities.
* “Unmet need” is the gap that remains between a student’s resources and his/her total cost of attendance even after accounting for grant aid, loan aid, and EFC.
**EFC is the formulaically determined amount that the student can reasonably be expected to pay out of pocket.
Sources: Texas Higher Education Coordinating Board (THECB), “Unmet Need and Unexpected Family Contribution” (unpublished tables).
Baccalaureate Graduation Status by Unmet Need Amount, 2010-2011 Public Texas High School Graduates Enrolled in Fall 2011 in Texas Higher Education
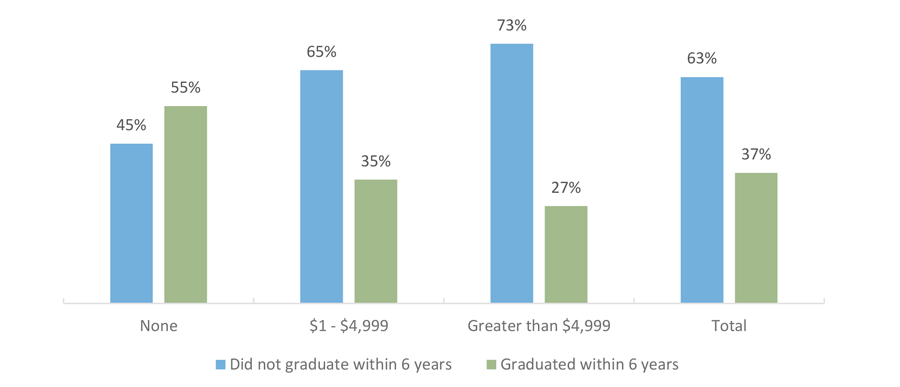
University students in Texas who had no unmet need were more likely to obtain a bachelor’s degree than their peers who had unmet need. Over half of students with no unmet need had graduated within six years of initially enrolling in college, compared to 35 percent of those with unmet need below $5,000 and just 27 percent of those with higher unmet need.
Unmet need is the gap that remains between a student’s resources and his/her total cost of attendance even after accounting for grant aid, loan aid, and expected family contribution (EFC; the formulaically determined amount that the student can reasonably be expected to pay out of pocket). The cost of attendance is the estimated sum of tuition and fees, books and supplies, food and housing, transportation, and other expenses for a full-time student for nine months.
Sources: Texas Higher Education Coordinating Board (THECB), “Baccalaureate Graduation Status within Six Years by Unmet Need” (unpublished tables; special request).
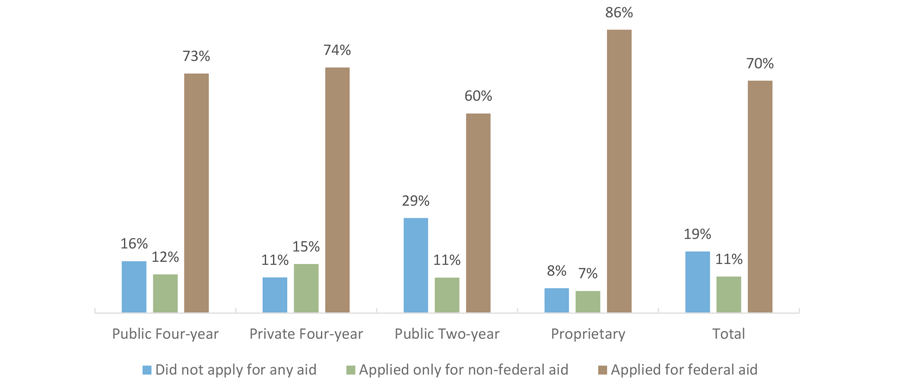
Applied for Any Aid, by Sector (in AY 2015-2016)
Reasons For Not Applying for Financial Aid, (in AY 2015-2016)
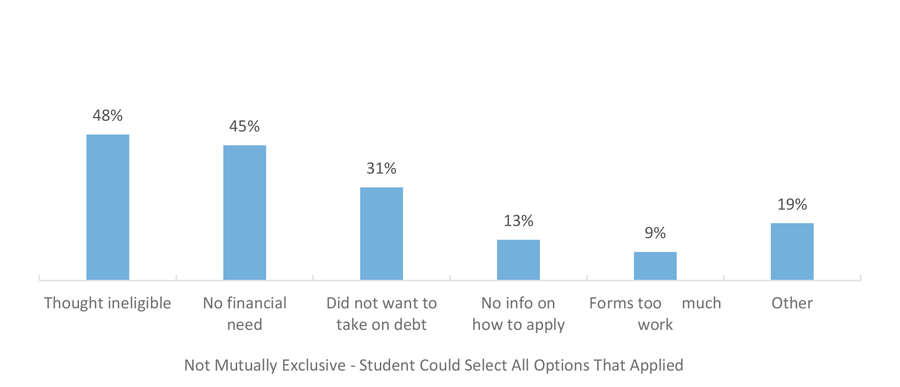
About four in five undergraduates nationwide had applied for some form of aid in academic year (AY) 2015-2016. Most of the students who applied for aid had applied for federal aid, with a small minority only applying for non-federal aid. Almost a third of students who did not apply for any aid said that they did not want to take on more debt, and almost half marked that they thought they were ineligible and/or they had no financial need.
Sources: U.S. Department of Education, National Postsecondary Student Aid Study (NPSAS) 2016 (http://www.nces.ed.gov/das).
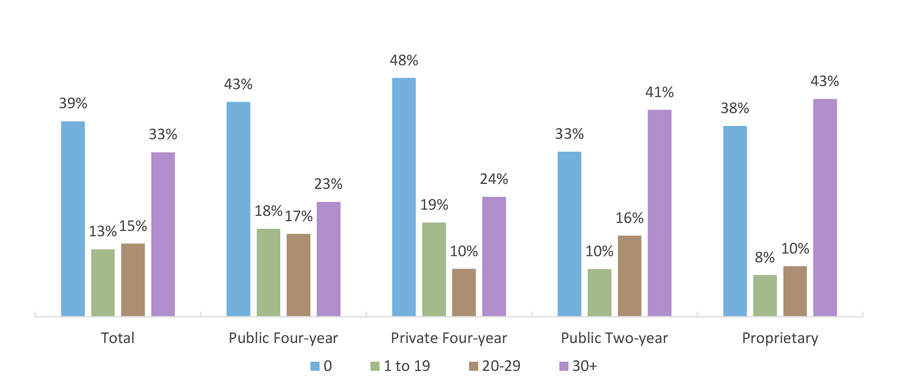
Hours Worked* per Week by Sector (AY 2015-2016)
Percentage Working Zero Hours per Week by Sector and Enrollment Intensity (AY 2015-2016)
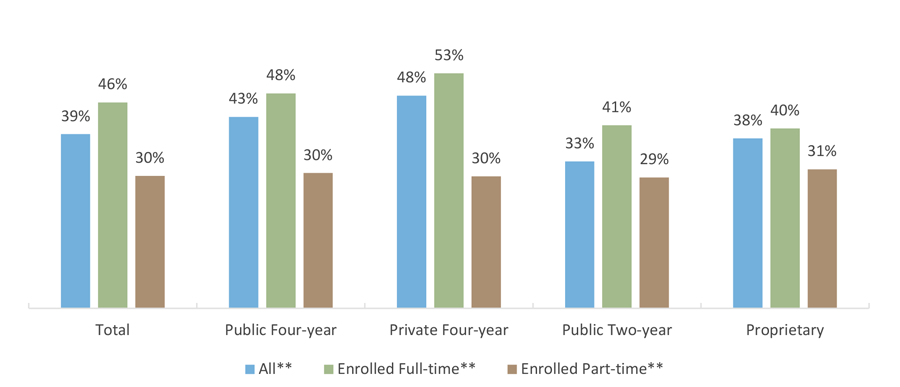
Overall, a third of undergraduates across the nation are working at least 30 hours per week, while 39 percent of students did not work during the 2015-2016 Academic Year (AY). These proportions vary by sector. Close to half of students at private four-year institutions and 43 percent of those at public four-year institutions did not work, and about a quarter of students at those sectors worked 30 hours or more per week. Students enrolled full-time are more likely to have worked no hours compared to students enrolled part-time.
*Excludes work-study
**Only those who were enrolled exclusively full-time or exclusively part-time for both the fall 2015 and spring 2016 semesters.
Sources: U.S. Department of Education, National Postsecondary Student Aid Study (NPSAS) (http://www.nces.ed.gov/das), 2016.
Considers Self as a Student Working to Meet Expenses (AY 2015-2016)
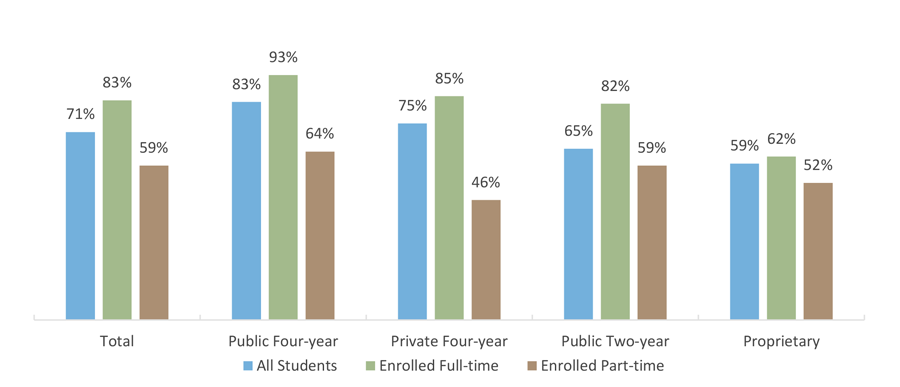
When asked if they consider themselves to be a student working to meet expenses or a worker who is going to school, 71 percent of students nationwide who worked while enrolled considered themselves to be a student rather than an employee during Academic Year 2015-2016. A majority of students across all sectors considered themselves to be students who work, but the proportions varied from 83 percent of public four-year students to 59 percent of proprietary students.
The proportions also varied by enrollment intensity. Nationwide, 83 percent of full-time students considered themselves to be students who work compared to 59 percent of students enrolled part-time.
*Only students with jobs (includes work-study).
Sources: U.S. Department of Education, National Postsecondary Student Aid Study (NPSAS) (http://www.nces.ed.gov/das), 2016.
Work Study Job Hours Worked per Week, by Sector (AY 2015-2016)
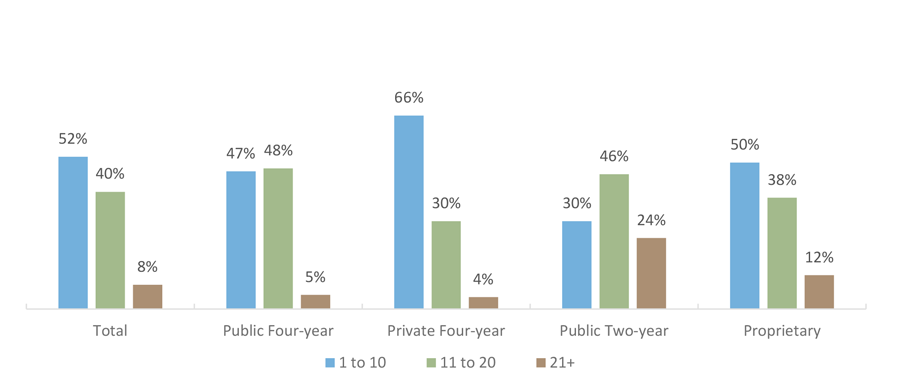
More than half of undergraduates across all sectors nationwide who had a work-study job worked 10 hours or fewer per week in that jobs and another 40 percent worked between 11 and 20 hours per week. Work-study students at public two-year institutions were more likely to work longer hours per week compared to their peers at all other sectors. About a quarter of all public two-year work-study students worked more than 20 hours per week at their work-study jobs.
Employed Students: Job Related to Major or Field of Study, by Sector (AY 2015-2016)
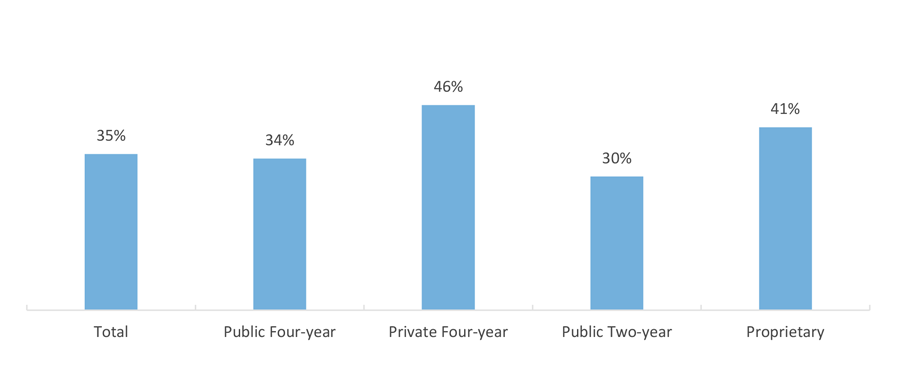
About two-thirds of students who were employed while enrolled worked at a job that they did not believe was related to their major or field of study. This varied somewhat by section, with almost half of private four-year students holding work-study jobs related to their major compared to only about a third of students in the public two-year sector.
Sources: U.S. Department of Education, National Postsecondary Student Aid Study (NPSAS) (http://www.nces.ed.gov/das), 2016.
Hours of Minimum Wage Work per Week Needed to Pay for an Average Undergraduate Education in Texas, by Sector (2003 to 2017)
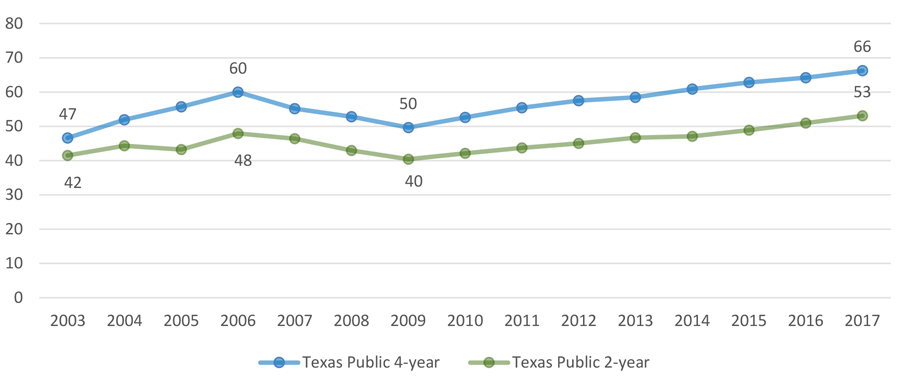
In earlier decades, many students financed an undergraduate education by taking a full course load while working enough hours to cover living and educational expenses, perhaps with the aid of savings from a full-time summer job. From 1966 to 1981, a time in which the minimum wage increased fairly regularly, an industrious undergraduate could have paid for a year of education at a public university — including tuition, food, and housing — by working about 24 hours per week at a minimum wage job.
In the early 1980s, as the cost of education began to climb and the minimum wage increased less frequently, the number of work hours needed to pay for an education began to rise. The hours needed to pay for an undergraduate education continued to inch upward in the 1990s, then rose again sharply at the turn of the century.
In 2017-2018, an in-state, residential undergraduate would have had to work 66* hours every week of the year to pay for two semesters at a Texas public university, and 53** hours for two semesters at a Texas community college. This is a slight increase from the previous year and is a continuation of the upward trend beginning in 2010, which reflects the period of annual minimum wage increases (2006-2009) coming to an end.
*The average student budget for an in-state, residential student at a Texas public four-year university in AY 2017–2018 was $23,418. The At a net of $6.80 per hour, a full-time Texas student with no other financial aid or assets would have to work 3,443 hours per year, or 66 hours per week, to put him or herself through school.
**The average student budget for an in-state, residential student at a Texas public community college in AY 2017–2018 was $18,770. The At a net of $6.80 per hour, a full-time Texas student with no other financial aid or assets would have to work 2,760 hours per year, or 53 hours per week, to put him or herself through school.