
State of Student Aid in Texas – 2019
Texas, National Three-year Cohort Default Rates* (FY 2009–2015)
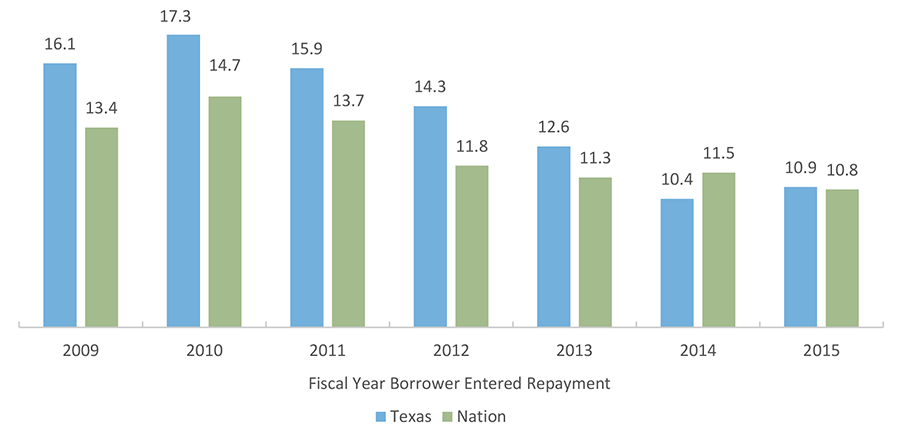
After peaking in fiscal year (FY) 2010, federal cohort default rates (CDRs) have gradually declined for both Texas and the nation. During this period of improvement, the difference between Texas and national CDRs have narrowed to where the two are now nearly the same.
While the precise reason(s) for the recent decline in CDRs is not known, past evidence and other recent trends suggest it may have been caused at least partially by general economic improvement (particularly the falling unemployment rate) and increased usage of repayment flexibility options like income-driven repayment plans. The federal government and many institutions have made new efforts to inform borrowers of these repayment plans, which cap monthly payments at a percentage of income and require no payments at all below a certain income threshold. Improvements in student success indicators likely also contributed to lower CDRs.
*A three-year cohort default rate is the percentage of student borrowers with loans entering repayment in a given fiscal year who default on their obligations during that given fiscal year or in the next two fiscal years that follow. The FY 2015 cohort default rate, for example, is based on student borrowers who entered repayment during FY 2015 and subsequently defaulted by the end of FY 2017.
Sources: U.S. Department of Education, Fiscal Year Three-Year Official Cohort Default Rates, Washington, D.C., 2018.
Three-year Cohort Default Rates* (FY 2015)
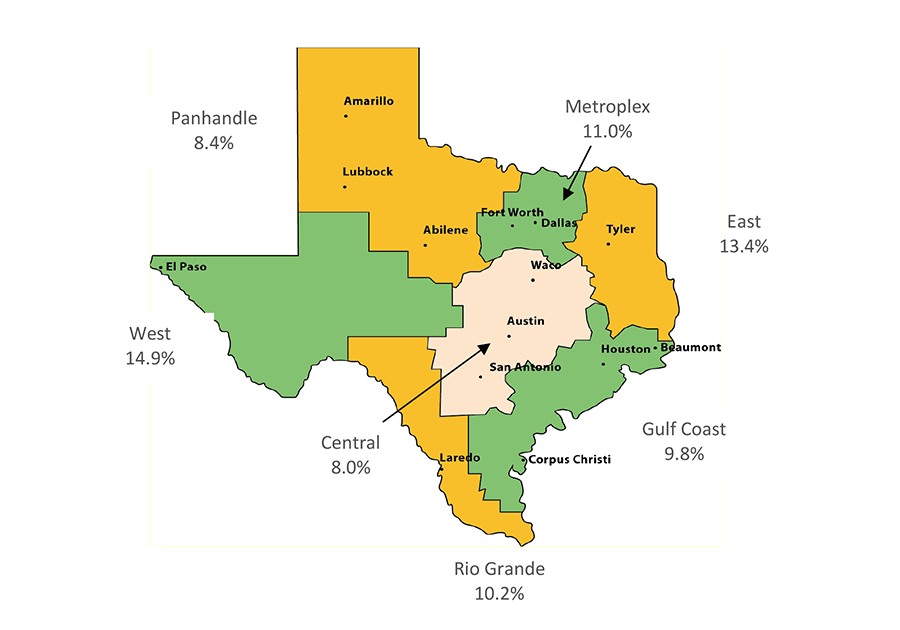
The overall Fiscal Year (FY) 2015 three-year cohort default rate (CDR) for Texas was 10.9 percent (compared to 10.4 percent in FY 2014). Texas’ FY 2015 CDR was 0.1 percentage points higher than the 10.8 default rate for the nation.
Cohort default rates vary substantially from region to region, from a high of 14.9 percent in the West Texas region to a low of 8.0 percent in the Central Texas region. All of the Texas regions experienced an increase in the three-year default rates between FY 2014 and FY 2015 except for the Panhandle and Central regions. The largest differences were seen for schools in the Panhandle region, where the three-year CDR dropped 1.3 percentage points between FY 2014 and FY 2015, and for schools in the Rio Grande Valley region, where the CDR increased one percentage point.
*A three-year cohort default rate is the percentage of student borrowers with loans entering repayment in a given fiscal year who default on their obligations during that given fiscal year or in the next two fiscal years that follow. For example, the FY 2015 cohort default rate is based on student borrowers who entered repayment during FY 2015 and subsequently defaulted by the end of FY 2017.
Sources: U.S. Department of Education, Fiscal Year 2014 and Fiscal Year 2015 Three-Year Official Cohort Default Rates, Washington, D.C., 2018.
Texas Three-year Cohort Default Rates* by School Type
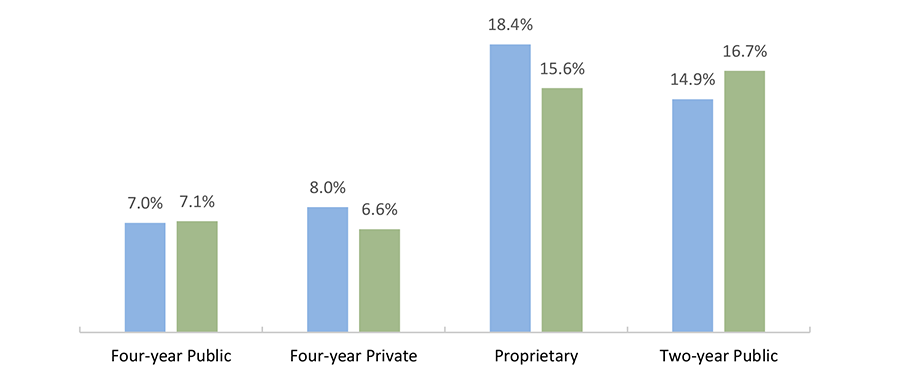
Texas borrowers who attended short-term programs have a combined FY 2015 three-year cohort default rate (CDR) more than twice the rate of those who attended four-year schools (16.0 percent and 7.2 percent, respectively). Although some proprietary schools offer bachelor’s degrees or higher, most proprietary schools in Texas offer short-term programs exclusively. At 18.4 percent, the highest FY 2015 three-year CDR is for the proprietary sector, followed by the two-year sector with a 14.9 percent CDR. This is a minor reversal compared to the nation as a whole, where the proprietary sector had a slightly lower CDR than the public two-year sector. All sectors in Texas had an increase in their rate from FY 2014 to FY 2015.
There are several factors that contribute to the tendency toward higher CDRs for short-term programs, as compared to four-year schools. For example, borrowers from short-term programs are more likely to have risk factors for dropping out of school, such as attending school part time and working full time, than are students from four-year colleges and universities. Also, earnings tend to be lower for graduates of short-term programs compared with graduates of four-year schools.
*A three-year cohort default rate is the percentage of student borrowers with loans entering repayment in a given fiscal year who default on their obligations during that given fiscal year or in the next two fiscal years that follow. The FY 2015 cohort default rate, for example, is based on student borrowers who entered repayment during FY 2015 and subsequently defaulted by the end of FY 2017.
Sources: Cohort Default Rates: U.S. Department of Education, Fiscal Year 2015 Official Cohort Default Rates, Washington, D.C., 2018; All Other: U.S. Department of Education, National Center for Education Statistics, “National Postsecondary Student Aid Study (NPSAS) 2016” (http://www.nces.ed.gov/das/).
Percentage of Borrowers Who Defaulted within 12 Years of Starting College, by Degree Type
1995-96 and 2003-04 Cohorts
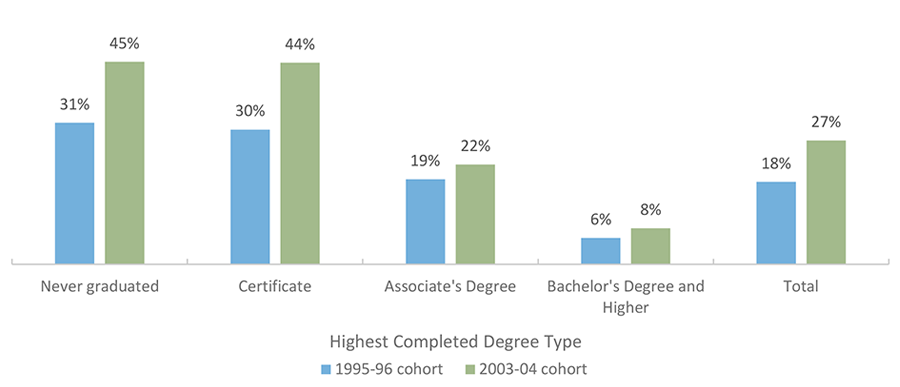
Approximately 31 percent of all student borrowers who first started their postsecondary education in the 1995-96 academic year and did not graduate had defaulted sometime during the 12 years after first starting college. A nearly identical percentage of certificate earners also defaulted during that timeframe. The default rates for associate’s degree and bachelor’s degree holders were lower. Just under six percent of borrowers who earned a bachelor’s degree or higher had defaulted on their loans in the 12-year timeframe.
The default rates for borrowers who first started college in the 2003-04 academic year were higher across all categories, particularly among certificate holders and those who never graduated. This is likely due in part to the 2007-08 economic recession that hit many of those borrowers early in their work life following college. Those with less education have higher unemployment rates than those with more, and this was certainly true during and following the recession.
There are several factors that contribute to the tendency toward higher default rates for short-term programs, such as certificate programs and associate’s degrees, as compared to four-year schools. For example, borrowers from short-term programs are more likely to have risk factors for dropping out of school, such as attending school part time and working full time, than are students from four-year colleges and universities. Also, earnings tend to be lower for graduates of short-term programs compared with graduates of four-year schools.
When the timeframe for tracking the 1995-96 cohort was extended from 12 to 20 years, 25.4 percent of all student borrowers had defaulted. The more recent cohort has already exceeded that rate at just the 12-year mark.
Sources: Default Rates: U.S. Department of Education, National Center for Education Statistics, Repayment of Student Loans as of 2015 Among 1995-96 and 2003-04 First-Time Beginning Students, October 2017 (https://nces.ed.gov/pubsearch/pubsinfo.asp?pubid=2018410); Risk Factors: U.S. Department of Education, National Center for Education Statistics, “National Postsecondary Student Aid Study (NPSAS) 2012” (http://www.nces.ed.gov/das/); Unemployment Rates: Bureau of Labor Statistics. “Employment Status of the Civilian Population 25 Years and Over by Educational Attainment,” March 2018 (https://www.bls.gov/news.release/empsit.t04.htm).
Percentage of Borrowers Who Fully Paid Back Loans without Defaulting within 12 Years of Starting College
1995-96 and 2003-04 Cohorts
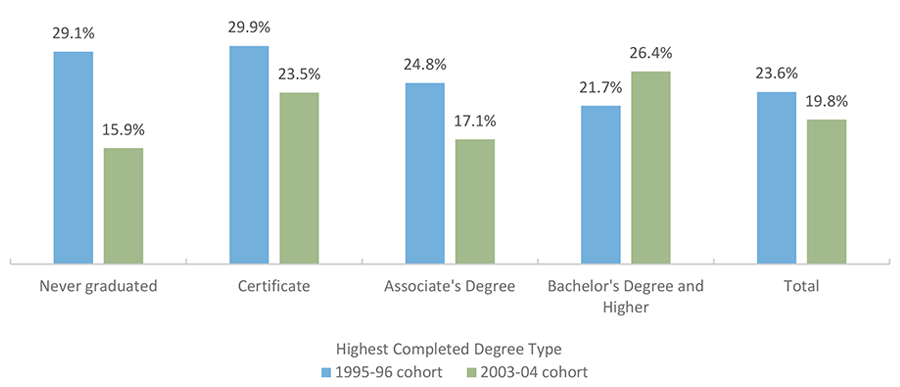
In a rare glimpse into long-term student loan repayment patterns, the National Center for Education Statistics (NCES) reported on two cohorts of borrowers, one that started school in the 1995-1996 academic year (AY) and another that started in AY 2003-2004. About one in five borrowers from the 2003-2004 cohort had repaid their loans within 12 years of first starting school, a four-percentage point decline from the 1995-1996 cohort.
While full repayment success generally declined in the latter cohort, it increased among bachelor’s degree or higher recipients. Degree recipients had higher rates of full repayment than borrowers who never graduated. Among borrowers with degrees from the 2003-2004 cohort, those with bachelor’s degrees or higher had the greatest success (26.4 percent), followed by those with certificates (23.5 percent).
The differences between degree recipients may be moderated due to borrowers in longer term programs borrowing higher amounts and only beginning repayment many years later than those in short-term programs.
Conversely, the 2007-08 economic recession that would have hit many of the 2003-04 cohort of borrowers early in their work life following college was harsher on borrowers in short-term programs and may have enlarged gaps in full repayment compared to those in bachelor’s degree and higher programs. Although unemployment rates rose for everyone during the recession, the rates remained lower for those with higher levels of education. It may be that those with a bachelor’s degree or higher were better able to secure and maintain employment during and following the recession compared to those with lower levels of education, making full repayment more likely.