
State of Student Aid in Texas – 2019
Weighted Average Public Four-year University Cost of Attendance for Two Semesters for Full-time Undergraduates Living Off Campus in Texas and the U.S. (AY 2016–2017 and AY 2017–2018)
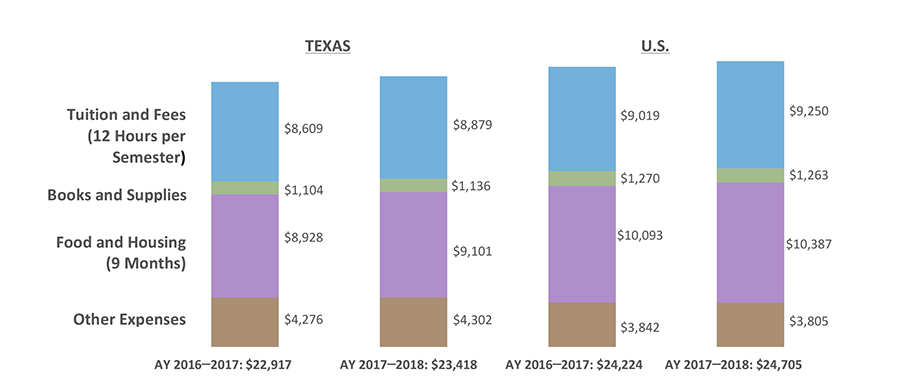
The tuition and fees charged to students, along with living expenses, books and supplies, transportation, and other expenses, constitute a school’s cost of attendance. From 2017 to 2018, total costs increased by $501 in Texas and $481 nationally. Weighted for enrollment,* two semesters of full-time** undergraduate education at a Texas public four-year university averaged $23,418 in Award Year (AY) 2017–2018. This amount was $1,287 less than the national average. Total expenses in Texas have been below the national average for many years. With the exception of the “other expenses” category, all types of costs in Texas are lower than their corresponding national averages. The primary expenses facing students are not tuition and fees but food and housing, which make up nearly 40 percent of the cost of attendance. These costs are not discretionary: students must eat, and unless they live with parents — and 78 percent of U.S. public university undergraduates do not — they must pay rent. Together, food, housing, and other expenses comprise about 57 percent of the student budget, while tuition and fees make up 38 percent.
Cost of attendance is the starting point for determining financial aid. From the cost of attendance, the student’s expected family contribution (EFC)*** is subtracted to calculate the student’s financial need. Once financial need is determined, an aid package, consisting primarily of grants and loans, can be developed. What students actually pay for college depends on a number of factors, including the aid they receive and how frugally they live, as well as their enrollment patterns. To cut costs, many students enroll part time, work long hours, or both — but these strategies may increase their chance of dropping out of school without completing their program of study.
* An institution’s costs are multiplied by its enrollment. The sum of costs for all schools is then divided by full-time, undergraduate enrollment, such that schools with higher enrollments are given greater weight. See glossary for clarification.
** 12 semester hours or more.
*** EFC is determined through a federal formula that considers family income and size as well as the number of children in college, among other factors. The average amount that families actually contribute to educational expenses is unknown. In AY 2015–2016, 18 percent of dependent undergraduates enrolled at public four-year universities nationwide reported that they received no help from their parents in paying education and living expenses.
Sources: All Costs and Enrollments for 2017–2018: U.S. Department of Education, National Center for Education Statistics, Integrated Postsecondary Education Data System (IPEDS) 2017 (http://nces.ed.gov/ipeds/); All Costs and Enrollments for 2016–2017: U.S. Department of Education, National Center for Education Statistics, Integrated Postsecondary Education Data System (IPEDS) 2016 (http://nces.ed.gov/ipeds/); All other: U.S. Department of Education, National Postsecondary Student Aid Study (NPSAS) 2012 (http://www.nces.ed.gov/das).
Weighted Average Public Two-year College Cost of Attendance for Two Semesters for Full-time Undergraduates Living Off Campus in Texas and the U.S. (AY 2016–2017 and AY 2017–2018)
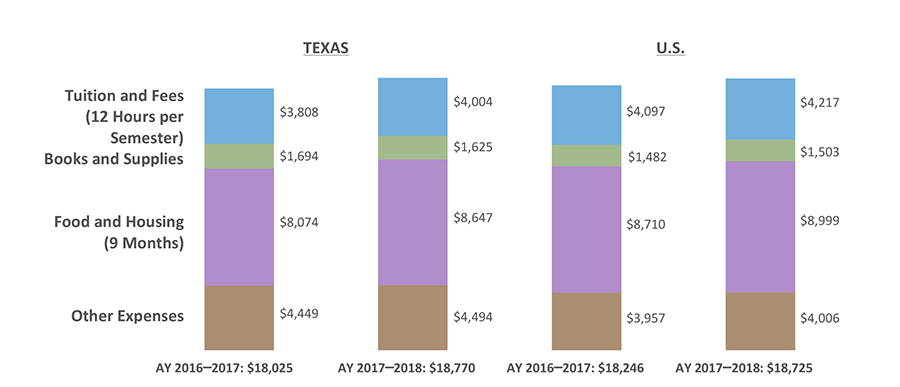
Forty-nine percent of all Texas postsecondary students were enrolled in public two-year colleges in Award Year (AY) 2016-2017. The cost for two full-time* semesters at Texas public two-year colleges, weighted for enrollment,** averaged $18,770 in AY 2017–2018. This is an increase of $745 over the Texas average in AY 2016–2017 and is $45 more than the AY 2017–2018 national average. Costs in all categories have increased in Texas and nationally since AY 2016–2017, with the largest increases occurring in the food and housing category in Texas.
The total cost of attendance for a student includes tuition and fees, books and supplies, and living expenses. The student’s financial need is calculated by subtracting the expected family contribution (EFC)*** from the cost of attendance, which is the basis for determining the financial aid package. This package consists primarily of grants and loans. The actual amount that students pay for college depends upon factors such as how much and what type of aid they receive, how frugally they live, and the number of credit hours they take. To save money, students may enroll in school part time, work long hours, or both — but these strategies may increase their chance of dropping out of school without completing their program of study.
* 12 semester hours or more.
** An institution’s costs are multiplied by its enrollment. The sum of costs for all schools is then divided by full-time, undergraduate enrollment, such that schools with higher enrollments are given greater weight. See glossary for clarification.
*** EFC is determined through a federal formula that considers family income and size as well as the number of children in college, among other factors. The average amount that families actually contribute to educational expenses is unknown. In AY 2015–2016, 29 percent of dependent undergraduates enrolled in public two-year colleges nationwide reported that they received no help from their parents in paying education and living expenses.
Sources: All Costs and Enrollments for 2017–2018: U.S. Department of Education, National Center for Education Statistics, Integrated Postsecondary Education Data System (IPEDS) 2017 (http://nces.ed.gov/ipeds/); All Costs and Enrollments for 2016–2017: U.S. Department of Education, National Center for Education Statistics, Integrated Postsecondary Education Data System (IPEDS) 2016 (http://nces.ed.gov/ipeds/); All other: U.S. Department of Education, National Postsecondary Student Aid Study (NPSAS) 2016 (http://www.nces.ed.gov/das).
Weighted Average Private Four-year University Cost of Attendance for Two Semesters for Full-time Undergraduates Living Off Campus in Texas and the U.S. (AY 2016–2017 and AY 2017–2018)
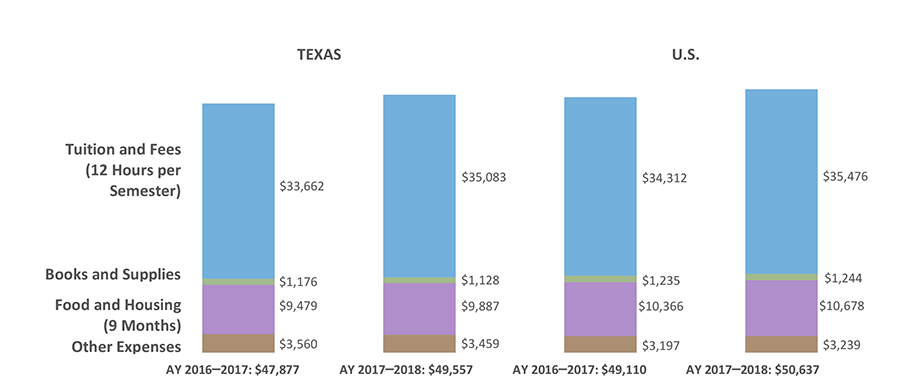
The increase from Award Year (AY) 2016–2017 to AY 2017–2018 of the average cost of attendance at private four-year universities in Texas, at $1,680, was due almost entirely to an average $1,421 increase in tuition and fees. Weighted for enrollment,* the total cost of attendance for undergraduates at Texas private four-year universities for two full-time** semesters averaged $49,557 in AY 2017–2018. This is lower than the national cost of attendance for the same year, at $50,637. The difference is mainly because tuition and fees in Texas are $393 lower than the national average and food and housing costs in Texas are $791 lower than the national average. Approximately seven percent of students in higher education in Texas in AY 2016–2017 enrolled in private four-year universities, versus 39 percent who enrolled in public four-year universities.
As with public institutions, students who enroll in private four-year universities may receive an aid package, which primarily consists of grants and loans. A student’s need is calculated by subtracting the expected family contribution (EFC)*** from the cost of attendance in order to determine what kind of financial aid package they should receive. The total cost of attendance includes tuition and fees, books and supplies, and living expenses. To save money, students may choose to enroll in school part time, work long hours, or both — but these strategies may increase their chance of dropping out of school without a degree.
* An institution’s costs are multiplied by its enrollment. The sum of costs for all schools is then divided by full-time, undergraduate enrollment, such that schools with higher enrollments are given greater weight. See glossary for clarification.
** 12 semester hours or more.
*** EFC is determined through a federal formula that considers family income and size as well as the number of children in college, among other factors. The average amount that families actually contribute to educational expenses is unknown. In AY 2015–2016, 17 percent of dependent undergraduates enrolled at private four-year universities nationwide reported that they received no help from their parents in paying education and living expenses.
Sources: All Costs and Enrollments for 2017–2018: U.S. Department of Education, National Center for Education Statistics, Integrated Postsecondary Education Data System (IPEDS) 2017 (http://nces.ed.gov/ipeds/); All Costs and Enrollments for 2016–2017: U.S. Department of Education, National Center for Education Statistics, Integrated Postsecondary Education Data System (IPEDS) 2016 (http://nces.ed.gov/ipeds/); All other: U.S. Department of Education, National Postsecondary Student Aid Study (NPSAS) 2016 (http://www.nces.ed.gov/das).
Change in Costs for Students Living Off Campus: Dollar and Percentage Change
(AY 2016–2017 to AY 2017–2018, Costs Weighted for Enrollment*)
| Texas | Public Four-Year | Public Two-Year | Private Four-Year | |||
|---|---|---|---|---|---|---|
| $ | % | $ | % | $ | % | |
| Tuition and Fees (12 Hours / Semester) | $270 | 3% | $196 | 5% | $1,421 | 4% |
| Books and Supplies | $32 | 3% | -$69 | -4% | -$48 | -4% |
| Food and Housing | $173 | 2% | $573 | 7% | $408 | 4% |
| Other | $26 | 1% | $45 | 1% | -$101 | -3% |
| Total Change | $501 | 2% | $745 | 4% | $1,680 | 4% |
| U.S. | Public Four-Year | Public Two-Year | Private Four-Year | |||
|---|---|---|---|---|---|---|
| $ | % | $ | % | $ | % | |
| Tuition and Fees (12 Hours / Semester) | $231 | 3% | $120 | 3% | $1,164 | 3% |
| Books and Supplies | -$7 | -1% | $21 | 1% | $9 | 1% |
| Food and Housing | $294 | 3% | $289 | 3% | $312 | 3% |
| Other | -$37 | -1% | $49 | 1% | $42 | 1% |
| Total Change | $481 | 2% | $479 | 3% | $1,527 | 3% |
Weighted for enrollment,* the total cost of attendance in all sectors in Texas and nationally increased between two and four percent between Award Year (AY) 2016–2017 and AY 2017–2018. By percentage, Texas had roughly equivalent or larger increases in all sectors compared to the nation.
The cost of attendance is the starting point for determining financial aid. What students actually pay for college depends on a number of factors, including the aid they receive and how frugally they live, as well as their enrollment and work patterns. To cut costs, many students enroll part time, work long hours, or both. In AY 2015–2016, 56 percent of all undergraduates nationwide attended less than full time/full year — that is, they either took fewer than 12 hours per semester or did not attend at least two semesters — and 79 percent worked while enrolled (36 percent of which worked full time**). Full-time work and part-time enrollment are associated with each other and also with lower completion rates: 63 percent of U.S. undergraduates who work full time while enrolled attend less than full time/full year, slowing their academic progress.
* An institution’s costs are multiplied by its enrollment. The sum of costs for all schools is then divided by full-time, undergraduate enrollment, such that schools with higher enrollments are given greater weight. See glossary for clarification.
** 35 or more hours per week; includes work-study/assistantship.
Sources: All Costs and Enrollments for 2017–2018: U.S. Department of Education, National Center for Education Statistics, Integrated Postsecondary Education Data System (IPEDS) 2017 (http://nces.ed.gov/ipeds/); All Costs and Enrollments for 2016–2017: U.S. Department of Education, National Center for Education Statistics, Integrated Postsecondary Education Data System (IPEDS) 2016 (http://nces.ed.gov/ipeds/); All other: U.S. Department of Education, National Postsecondary Student Aid Study (NPSAS) 2016 (http://www.nces.ed.gov/das).
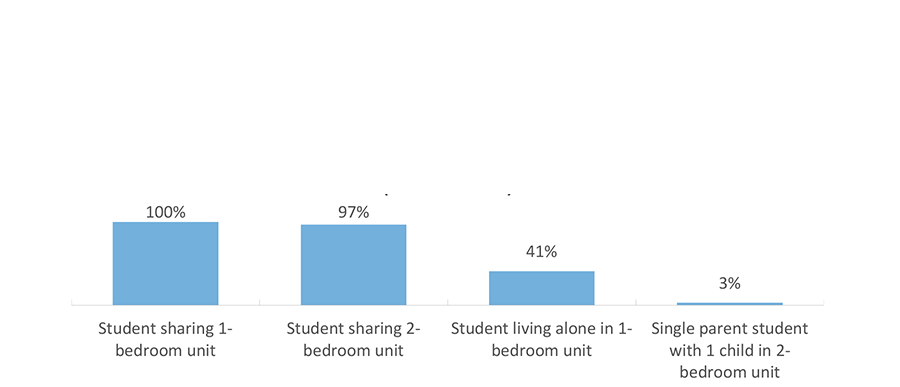
Percentage of Texas Public Universities Where the Institution’s Room and Board Estimate Covers the USDA/HUD Food and Housing Cost Estimate, by Living Situation (AY 2017–2018)
Food and housing make up nearly 40 percent of the cost of attending a public university in Texas. These costs are variable, but they are not discretionary. Students have some control over their lifestyle choice, but they must eat and pay rent. As the food and housing cost estimate is the largest single component of the official cost of attendance at both community colleges and public universities, it has critical implications for the types and amounts of financial aid that students are offered and the amounts institutions expect that students/families can afford to pay.
Using their knowledge of housing located in areas popular with students, Texas universities attempt to estimate the cost of food and housing that is modest but adequate. For the 2017–2018 Award Year (AY), this average estimate is $8,968,* or $996 per month. The U.S. Department of Agriculture (USDA) estimates the minimum dietary needs of an adult can be met on $268 per month provided that all food is prepared at home, an unlikely scenario for young adults. Subtracting $268 from $996 leaves $728 for rent and utilities. The addition of one small pepperoni pizza per week, however, would raise the monthly food budget to $310,** leaving $686 for rent and utilities.
The U.S. Department of Housing and Urban Development (HUD) estimates the average nine-month cost of rent and utilities for a one-bedroom unit in the counties and Metropolitan Statistical Areas (MSAs)*** where Texas public universities are located to be $6,972, or $775 per month. Sharing housing lowers the cost: a shared one-bedroom costs $387 per person and a shared two-bedroom costs $479.
These data suggest that a thrifty student who is a savvy grocery buyer, cooks nearly all his meals, and shares housing should stay within the institutional room and board estimate of $996 per month. However, a student who shares all these traits and lives alone will probably not be able to stay within the estimate at about half of Texas universities. At 97 percent of Texas universities, the room and board estimate is too low for a single parent with a dependent. About 12 percent of U.S. undergraduates in AY 2015–2016 had dependent children, and about 7 percent were single parents.
Average USDA/HUD Food and Housing Costs for Two Semesters (9 Months) for Counties and MSAs*** Where Texas Public Universities Are Located (AY 2017–2018)
| Student sharing 1-bedroom unit | Student sharing 2-bedroom unit | Student living alone in 1-bedroom unit | Single parent student with 1 child in 2-bedroom unit | |
|---|---|---|---|---|
| Food | $2,414 | $2,414 | $2,414 | $3,623 |
| Housing | $3,486 | $4,311 | $6,972 | $8,622 |
| Total | $5,900 | $6,725 | $9,386 | $12,245 |
*$9,101 when weighted for enrollment; see glossary for clarification.
** Based on the cost at Conan’s Pizza near the University of Texas at Austin, October 2018.
*** A Metropolitan Statistical Area is a geographic area of 50,000 or more inhabitants.
Source: All Costs and Enrollments for 2017–2018: U.S. Department of Education, National Center for Education Statistics, Integrated Postsecondary Education Data System (IPEDS) 2017 (http://nces.ed.gov/ipeds/); U.S. Department of Agriculture. “Official USDA Food Plans: Cost of Food at Home at Four Levels, U.S. Average, June 2018.” (http://www.cnpp.usda.gov/USDAFoodCost-Home.htm); U.S. Department of Housing and Urban Development (HUD). “Fair Market Rents 2018 for Existing Housing, October 2018,” (http://www.huduser.org/datasets/fmr.html); All other: U.S. Department of Education, National Postsecondary Student Aid Study (NPSAS) 2016 (http://www.nces.ed.gov/das).
Institutional Living Cost Allowance vs. County Cost of Living Estimate
| Sector | Institutions # |
Above Estimate by $3,000+ % |
Within $3,000 of Estimate % |
Below Estimate by $3,000+ % |
|---|---|---|---|---|
| 4-year or above | 2,538 | 8.3 | 60.9 | 30.8 |
| Public | 634 | 9.5 | 71.6 | 18.9 |
| Private not-for-profit | 1,200 | 7.8 | 55.4 | 36.8 |
| Private for-profit | 704 | 8.1 | 60.6 | 31.3 |
| 2-year | 2,107 | 10.1 | 60.4 | 29.5 |
| Public | 1,019 | 7.7 | 63.2 | 29.1 |
| Private not-for-profit | 126 | 15.9 | 53.1 | 31.0 |
| Private for-profit | 962 | 11.9 | 58.5 | 29.6 |
| Less-than-2-year | 1,797 | 15.1 | 45.3 | 39.6 |
| Public | 228 | 14.0 | 40.8 | 45.2 |
| Private not-for-profit | 66 | 4.5 | 48.5 | 47.0 |
| Private for-profit | 1,503 | 15.8 | 45.8 | 38.4 |
| Grand Total | 6,442 | 10.8 | 56.4 | 32.8 |
The federal definition of the cost of attendance (COA) includes tuition, fees, room and board (food, housing, transportation, and other miscellaneous costs of living), books, and supplies. The COA is important because it is part of the equation that helps determine how much financial aid students are eligible to receive in grants and loans from federal, state, and institutional sources. Federal law requires each institution to “determine an appropriate and reasonable amount” using its own method. Typically, institutions recalculate their COA annually. For direct educational costs, this is a relatively straightforward process. Determining living costs can be somewhat more complicated.
In keeping with federal law and the principal of local control, there is no regulation or standardized system for determining COA, including the living cost components. Schools use various methods to research and estimate these costs, including student surveys, interviews, and economic data. Organizations such as the National Association of Student Financial Aid Administrators and the College Board provide some guidance, but each institution has the flexibility and responsibility to reach its own estimate by its own means.
Sources: Wisconsin HOPE Lab, The Costs of College Attendance: Trends, Variation, and Accuracy in Institutional Living Cost Allowances, by Robert Kelchen, Braden J. Hosch, and Sara Goldrick-Rab (2014) (http://www.wihopelab.com/publications/Kelchen%20Hosch%20Goldrick-Rab%202014.pdf).
Percent Change in Average Tuition at Public Four-Year Colleges, Inflation Adjusted, 2008-2016
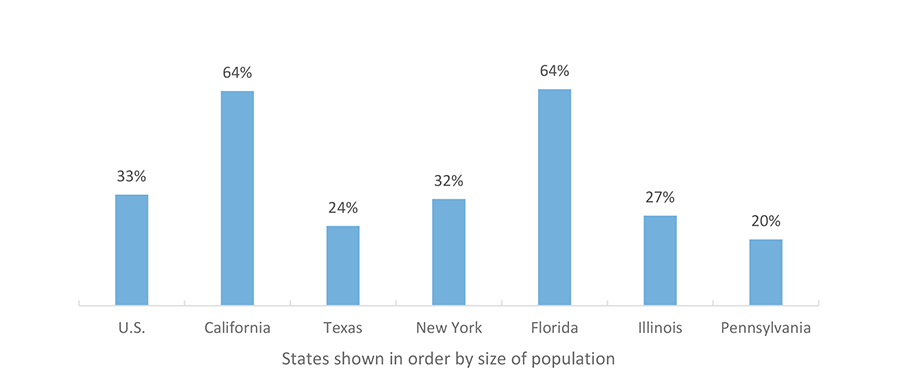
Overall, average tuition at public four-year institutions nationwide increased 33 percent between 2008 and 2016. Texas had one of the smaller increases in tuition over that time period among the top six states with a 24 percent increase.
Average Tuition and Fees at a Texas Public Four-Year University as a Percentage of Texas Median Household Income, by Race (2017)
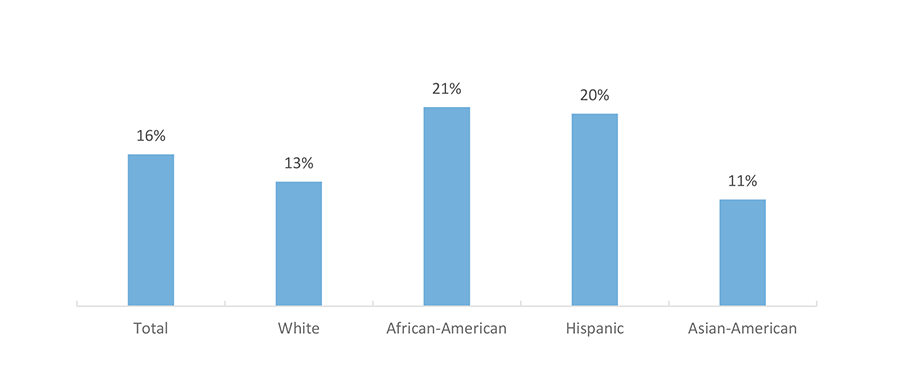
Average tuition and fees at Texas public four-year universities make up about 16 percent of the median Texas household income, but this varies by race. Tuition and fees made up about 11 percent of the median income of Asian-American students and 13 percent of White students, but 20 percent and 21 percent of Hispanic students and African-American students, respectively.
Source: Center on Budget and Policy Priorities, Funding Down, Tuition Up: State Cuts to Higher Education Threaten Quality and Affordability at Public Colleges, August 2016 (https://www.cbpp.org/research/state-budget-and-tax/funding-down-tuition-up).
Direct Student Aid by Source (AY 2015-2016*)
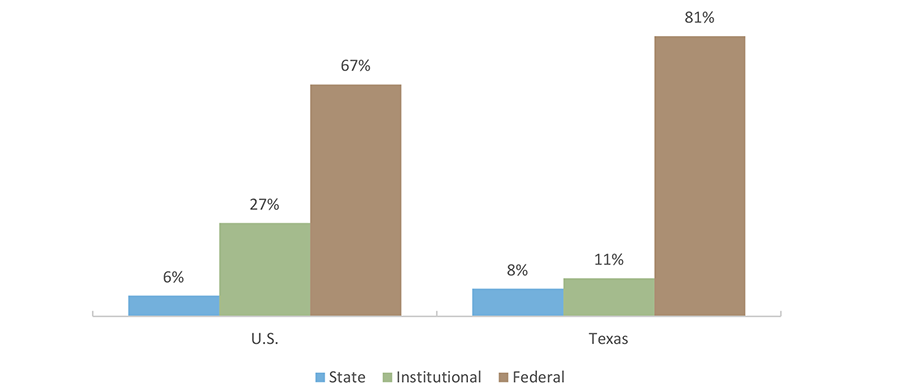
College students receive financial aid mainly from three major sources: the federal government, the state government, and the colleges and universities they attend (“institutional” aid). Of these three, the federal government’s contribution is by far the largest for most students. Nationally, the federal government provided 67 percent of the generally available direct financial aid* for undergraduate and graduate students in Award Year (AY) 2015–2016. In Texas, the federal government’s role is much larger, accounting for 81 percent of aid.
The Texas state government and state governments on average across the U.S. provided a similar percentage of the available aid to students in AY 2015–2016**, at eight percent and six percent respectively.
Texas colleges and universities, through institutional grants,*** provided a much smaller percentage of financial aid than colleges in other states. Texas institutions provided 11 percent of aid versus 27 percent for colleges nationally. This may be in part because relatively few students in Texas attend private institutions, which often charge high sticker prices but use much of the revenue to give large grants and scholarships to many students based on financial need, academic merit, and other factors.
Students may also receive tuition exemptions or waivers from their institutions. This type of aid is not included in the data in the chart due to data unavailability at the national level.
* Direct student aid includes aid that is generally available, goes directly to students, and derives from state and federal appropriations, plus institutional grants. All aid shown in graphs is for AY 2015–2016, except the private institutional aid in the Texas graph, which is for AY 2011–2012.
**The State of Texas, like other state governments, also supports public institutions through direct appropriations and tuition waivers.
*** Includes the Texas Public Educational Grant (TPEG) for AY 2015–2016 as well as private institutional aid reported to the Independent Colleges and Universities of Texas (ICUT) for AY 2011–2012.
Source: Private institutional aid: Independent Colleges and Universities of Texas (ICUT) “Annual Statistical Report 2013”, (http://www.icut.org/communications/publications); State aid and TPEG: Texas Higher Education Coordinating Board, “2015–16 Financial Aid Database,” Austin, Texas, (unpublished tables); Federal aid in Texas: U.S. Department of Education, Federal Student Aid Data Center (http://studentaid.ed.gov/sa/data-center/); Aid in the U.S.: The College Board. Trends in Student Aid 2017 (http://trends.collegeboard.org/).
Direct* Student Aid by Type (AY 2015-2016)
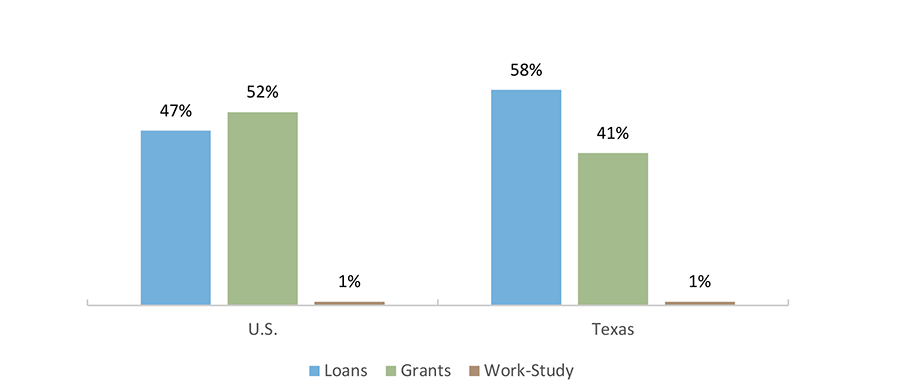
Compared to national averages, Texas college students have relied and continue to rely even more heavily on loans. In AY 2015–2016, 58 percent of aid in Texas came from loans and 41 percent came from grants, including state and institutional grants.* Nationally, 47 percent of aid was in the form of loans and 52 percent came from grants. Most student loans in Texas and nationwide are Federal Direct loans.
One percent of student aid in Texas and nationally comes from work-study dollars. The Federal Work-Study Program provides part-time jobs to students with financial need. Whether on campus or off campus, the program encourages employment related to the student’s course of study whenever possible.
Students may also receive tuition exemptions or waivers from their institutions. This type of aid is not included in the data in the chart due to data unavailability at the national level.
* Direct student aid includes aid that is generally available, goes directly to students, and derives from state and federal appropriations (including both FFELP and FDLP loans), plus institutional grants. All aid shown is for AY 2015–2016, except the private institutional aid in the Texas graph is for AY 2011–2012.
Source: Private institutional aid: Independent Colleges and Universities of Texas (ICUT) “Annual Statistical Report 2013”, (http://www.icut.org/communications/publications); State aid and TPEG: Texas Higher Education Coordinating Board, “2015–16 Financial Aid Database,” Austin, Texas, (unpublished tables); Federal aid in Texas: U.S. Department of Education, Federal Student Aid Data Center (http://studentaid.ed.gov/sa/data-center/); Aid in the U.S.: The College Board. Trends in Student Aid 2017 (http://trends.collegeboard.org).
Direct Student Aid by Source in Texas, by Sector (AY 2015-2016*)
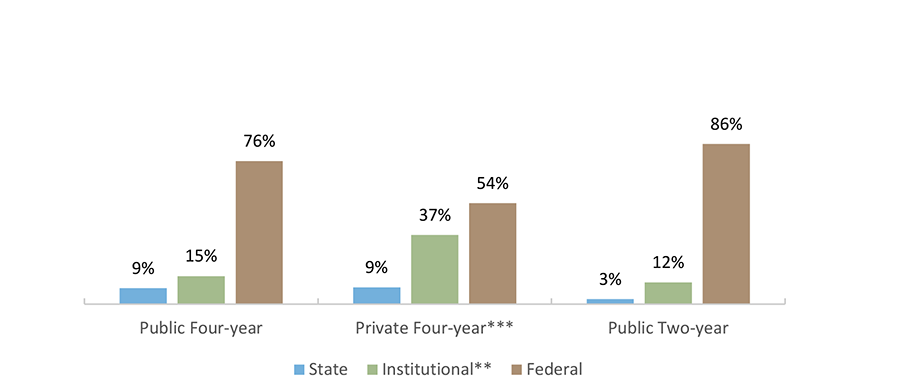
Students enrolled in the Texas public two-year sector are the most dependent on the federal government for their financial aid, followed closely by students in the public four-year sector. Students in the public four-year sector receive more state support, proportionally, than those in the two-year sector.
Direct Student Aid by Type in Texas, by Sector (AY 2015-2016*)
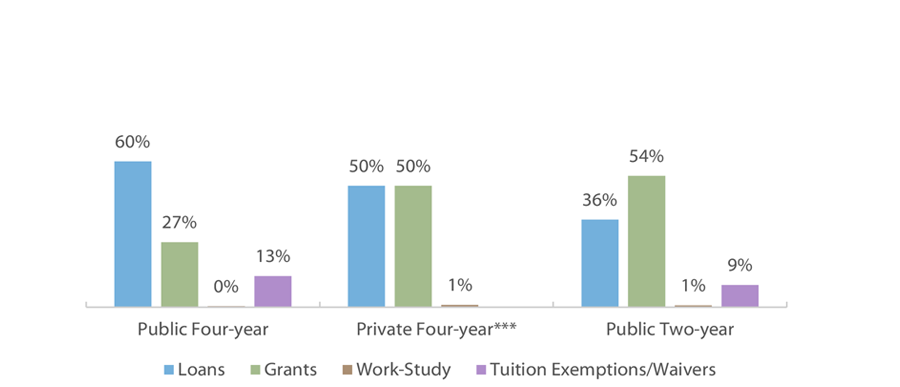
Direct student aid in the private four-year sector in Texas is split almost evenly between loans and grants. The student aid in the public two-year sector is more likely to be grants than loans (in large part because the federal Pell grant covers most if not all tuition/fee costs for many students), while the opposite is true for the public four-year sector. In all sectors, work-study aid encompasses less than one percent of total student aid.
* Direct student aid includes aid that is generally available, goes directly to students, and derives from state and federal appropriations (including both FFELP and FDLP loans), plus institutional grants. All aid shown is for AY 2015–2016, except the private institutional aid in the Texas graph is for AY 2011–2012. Comparable aid data for the private for-profit (proprietary) sector is unavailable.
** Tuition exemptions and waivers are included in institutional aid for the public sectors.
*** Data on tuition exemptions and waivers is only available for the public four-year and public two-year sectors.
Source: Private institutional aid: Independent Colleges and Universities of Texas (ICUT) “Annual Statistical Report 2013”, (http://www.icut.org/communications/publications); State aid and TPEG: Texas Higher Education Coordinating Board, “2015–16 Financial Aid Database,” Austin, Texas, (unpublished tables); Federal aid in Texas: U.S. Department of Education, Federal Student Aid Data Center (http://studentaid.ed.gov/sa/data-center/); Exemption/Waiver Data: Texas Higher Education Coordinating Board, “Report on Student Financial Aid in Texas Higher Education, Fiscal Year 2016” (http://www.thecb.state.tx.us/reports/PDF/10152.PDF?CFID=91323546&CFTOKEN=23302236).
The largest exemption program in fiscal year (FY) 2017 was the Hazlewood Exemption, a mandatory exemption program for veterans and their families, followed by exemptions for high school students enrolled in dual credit programs. The largest waiver programs were for merit-based scholarships for students and mandatory waivers for teaching or research assistants.
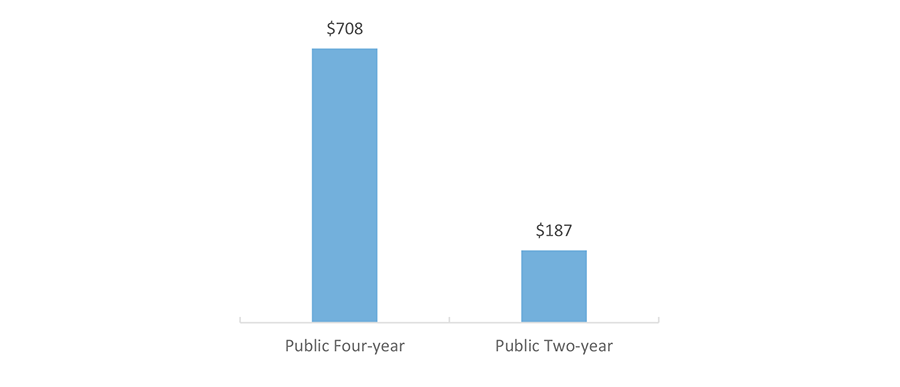
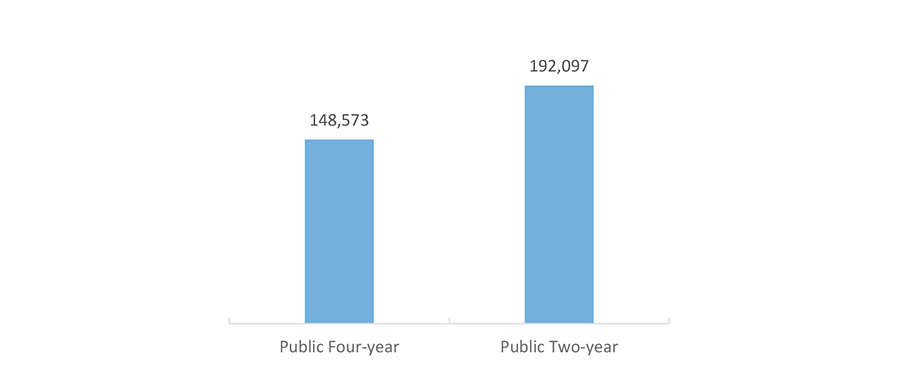
Although a higher number of students at community colleges benefited from exemption and waiver programs compared to university students, the proportion of dollars exempted or waived was much higher among university students than community college students due to higher tuition costs at universities.
FY 2017 Total Exemptions and Waivers Dollars, in Millions
FY 2017 Number of Recipients of Exemptions and Waivers
Source: Texas Higher Education Coordinating Board (THECB), Report on Student Financial Aid in Texas Higher Education, Fiscal Year 2017 (http://www.thecb.state.tx.us/reports/PDF/11713.PDF?CFID=87853513&CFTOKEN=86349658).
State Fiscal Support for Higher Education, by State and Year, in 2018 Dollars
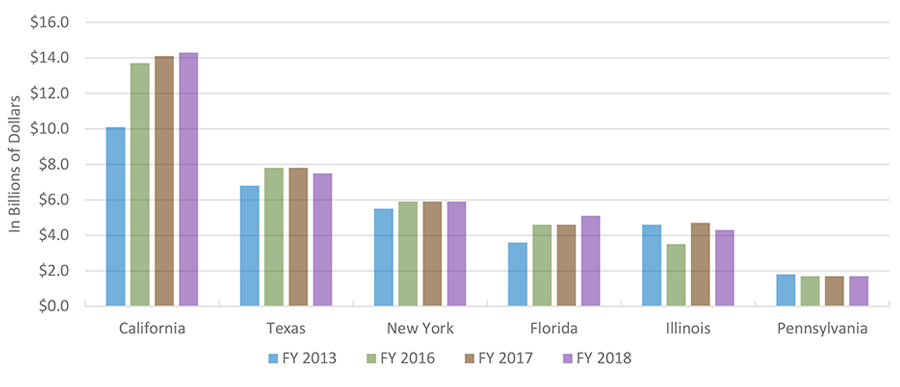
Nationally, state support for higher education has increased by about 12 percent over the past five years, from $78.7 billion in fiscal year (FY) 2013 (inflation adjusted to 2018 dollars) to $88.2 billion in FY 2018. Several of the most populous states also saw large increases like this over that same time period, including a 10 percent increase in Texas. Despite this increase since FY 2013, Texas saw a four percent decrease in state support from FY 2017 to FY 2018.
Percentage of State Higher Education Support by Type and State
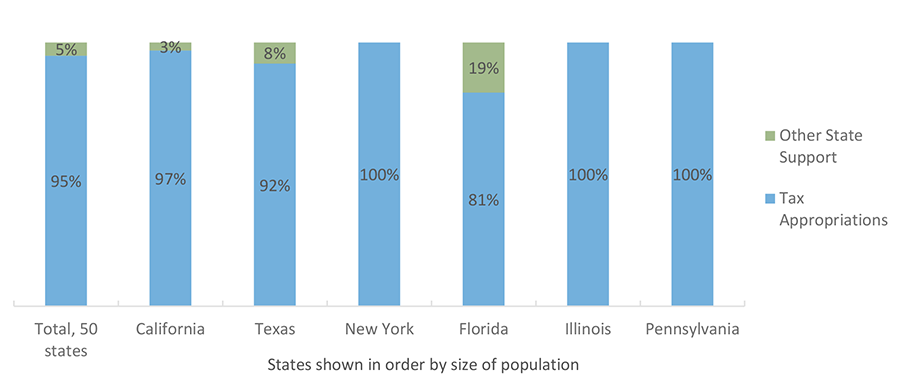
Most states allocate additional state support to higher education beyond tax appropriations. Sources for the additional state support are numerous and could include things like lottery monies, oil/mineral extraction fees on certain land, and interest on state-funded endowments. Three of the six most populous states did not provide additional state support outside of tax appropriations. About eight percent of state support for higher education in Texas comes from sources other than tax appropriations, similar to the national average of five percent.
Source: Illinois State University College of Education, Grapevine survey on state fiscal support for higher education, 2018 (https://education.illinoisstate.edu/grapevine/).
Estimated Total Tax Revenue of Texas Community Colleges, by Year, in Millions of Dollars
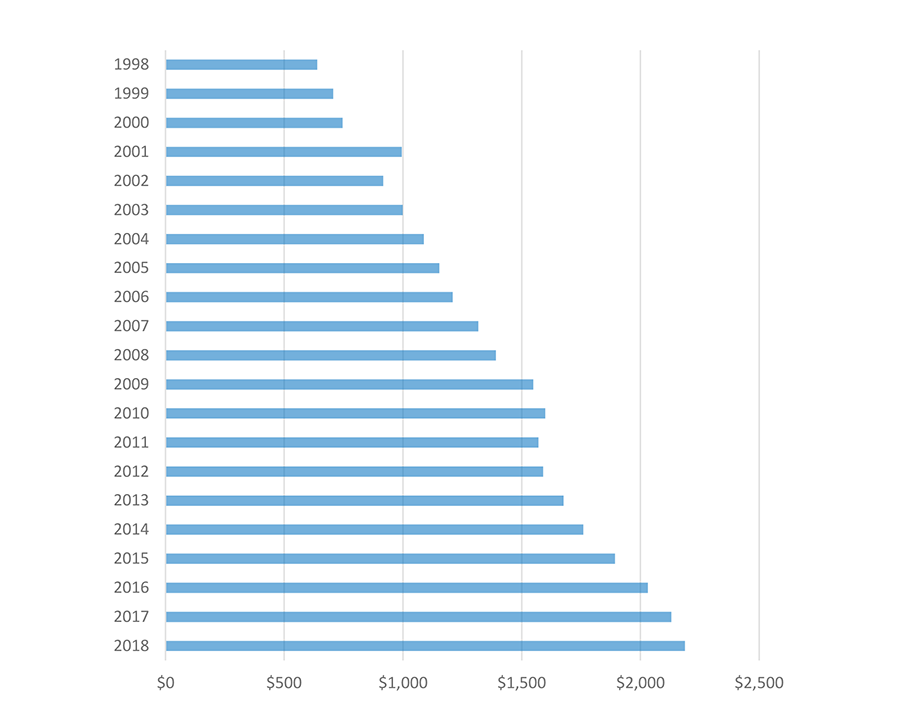
The estimated total tax revenue for all community colleges in Texas was just under $2.2 billion in 2018. The total tax revenue has increased nearly every year over the past two decades, making up an increasing share of overall community college revenue.
Note: Some community college districts have a mandatory tax rate freeze for certain citizens. The above figures are estimates based on projected tax rates and district valuation, not the actual amount collected by the district.
Source: Texas Association of Community Colleges (TACC), Tax & Valuation Survey Results (https://tacc.org/tacc/college-data); Texas Association of Community Colleges (TACC), Property Taxes at Texas Community Colleges, July 2017 (https://tacc.org/sites/default/files/documents/2018-08/property_tax_071717.pdf).
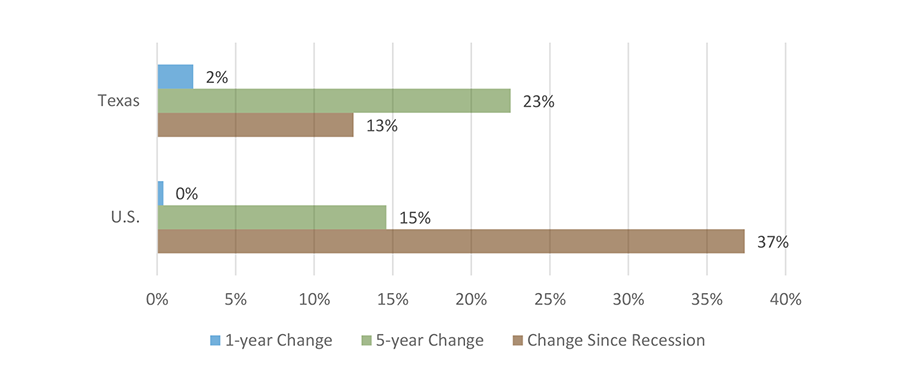
Percent Change in Public Higher Education Net Tuition Revenue Per Full-Time Equivalent Student (Constant Adjusted 2017 Dollars)
Percent Change in Educational Appropriations Per Full-Time Equivalent Student (Constant Adjusted 2017 Dollars)
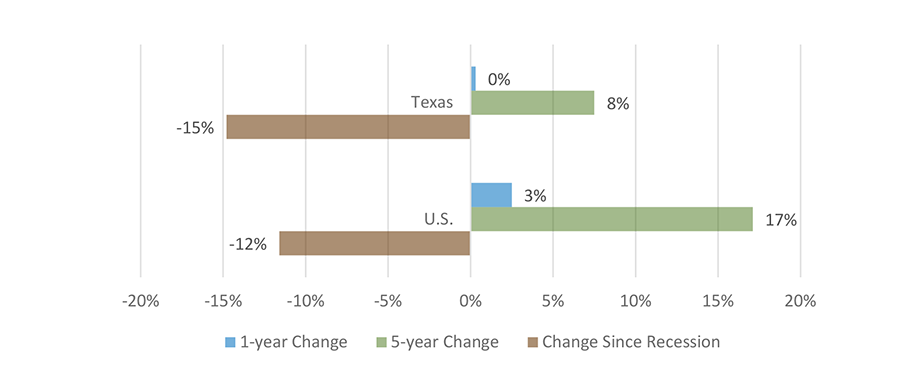
Texas and the U.S. have seen an increase in tuition revenue over since the recession, with Texas experiencing a 13 percent increase and the U.S. experiencing a 37 percent increase during that time period. Changes in enrollments, such as higher percentages of students in schools with lower or higher tuition rates, as well as changes in tuition rates may impact these percentages. Both Texas and the U.S. have seen positive changes in educational appropriations over the past five years, but both are still below pre-recession appropriation levels.
Source: State Higher Education Executive Officers Association (SHEEO), State Higher Education Finance: FY 2017 (http://www.sheeo.org/sites/default/files/SHEF_FY2017.pdf).
Percent Change in State Spending Per Student, Inflation Adjusted, 2008-2018
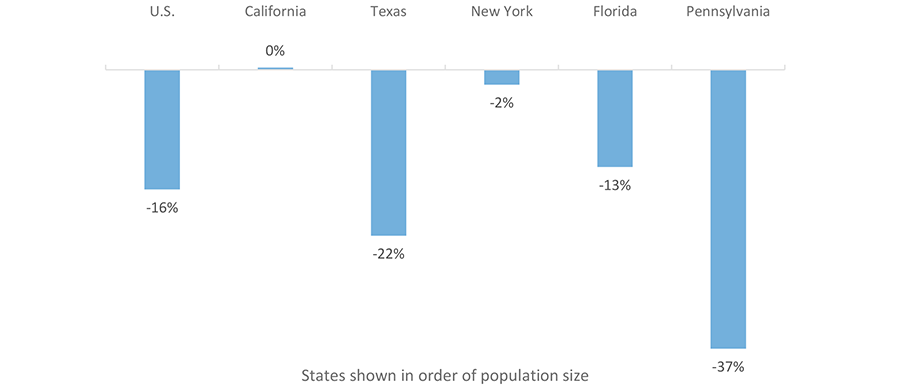
State spending per student has fallen nationwide by about 16 percent since 2008. Among the six largest states*, Texas had one of the largest drops in state spending per student, at 22 percent. California was one of only four states to have a positive change in state spending per student between 2008 and 2016.
* Illinois, the fifth largest state, is not included because of the unavailability of the data needed to make valid comparisons.