
State of Student Aid in Texas – 2019
Recent Studies of Food Security Amongst College Students Using the U.S. Department of Agriculture Scale
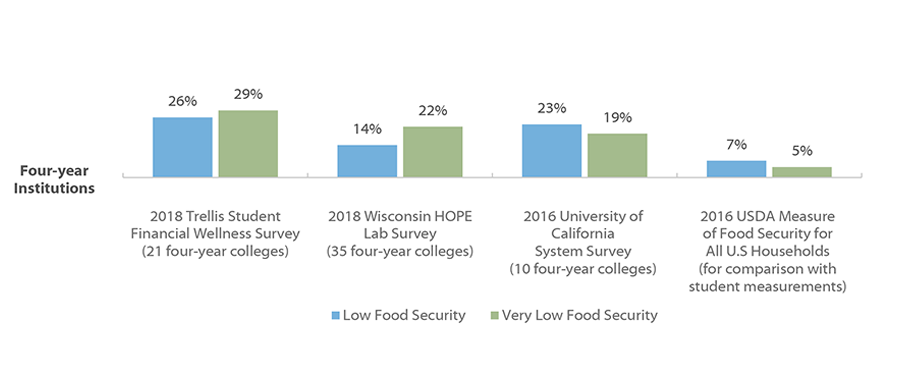
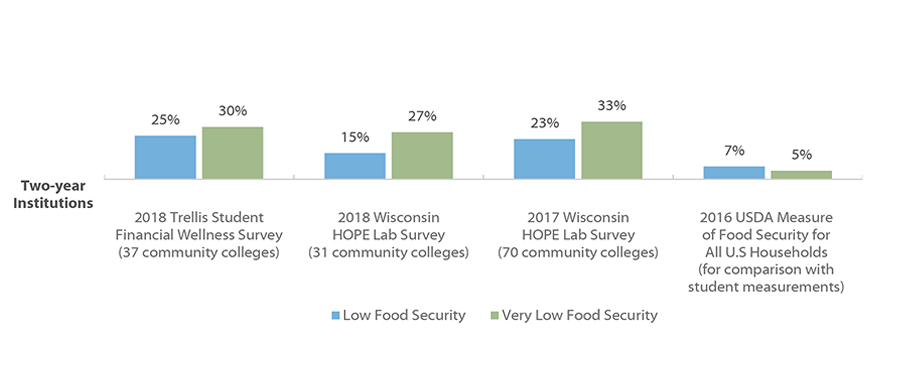
A growing body of research has explored the degree to which postsecondary students are struggling to meet their basic needs, such as housing and food. While more research is needed to explore the extent to which basic needs insecurity affects student success, it is reasonable to assume that students who struggle with hunger, nutrition, and/or finding safe shelter will have a more difficult path to earning a degree. The measurement tool designed by the United States Department of Agriculture (USDA) defines low food security as “reports of reduced quality, variety, or desirability of diet” and very low food security as “reports of multiple indications of disrupted eating patterns and reduced food intake.” While no nationally representative research is available for food insecurity among college students, a number of studies have found similar, troubling levels.
In the Fall 2018 Student Financial Wellness Survey (SFWS) from Trellis Company, but researchers found that 55 percent of students at four-year colleges and community colleges experience low or very low food security. The survey was open to any college that wanted to participate, and of the 58 colleges in the study, 37 were community colleges and 21 were four-year institutions. These results were similar to findings from studies by the HOPE Center for College, Community, and Justice, as well as a University of California System survey of food security. Greater food insecurity amongst the four-year institution cohort in the Trellis study may be explained by the participating institutions that tended to serve under-resourced students at higher rates than average four-year institutions.
Sources: United States Department of Agriculture (USDA). 2017. Definitions of food security. https://www.ers.usda.gov/topics/food-nutrition-assistance/food-security-in-the-us/definitions-of-food-security/; Klepfer, K. Cornett, A. Fletcher, C. & Webster, J. Student Financial Wellness Survey: Fall 2018 Unpublished Tables. Trellis Research; Goldrick-Rab, S., Richardson, J., Schneider, J., Hernandez, A., & Cady, C. (2018). Still Hungry and Homeless in College. Wisconsin HOPE Lab. https://hope4college.com/wp-content/uploads/2018/09/Wisconsin-HOPE-Lab-Still-Hungry-and-Homeless.pdf; Goldrick-Rab, S., Richardson, J., & Hernandez, A. (2017). Hungry and Homeless in College: Results from a National Study of Basic Needs Insecurity in Higher Education. Wisconsin HOPE Lab. https://hope4college.com/wp-content/uploads/2018/09/Hungry-and-Homeless-in-College-Report.pdf; Martinez, S., Maynard, K., & Ritchie, L. (2016). Student food access and security study. University of California Global Food Initiative. http://regents.universityofcalifornia.edu/regmeet/july16/e1attach.pdf; Coleman-Jensen, A. Rabbitt, M. Gregory, C. & Singh, A. 2017. Household Food Security in the United States in 2017, ERR-237, U.S. Department of Agriculture, Economic Research Service. https://www.ers.usda.gov/webdocs/publications/90023/err-256.pdf?v=0.
Housing Security and/or Homelessness within Prior Twelve Months at Community and Four-year Colleges
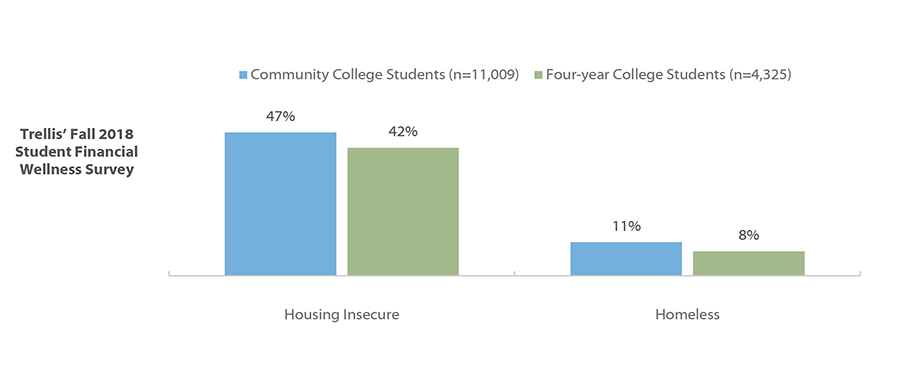
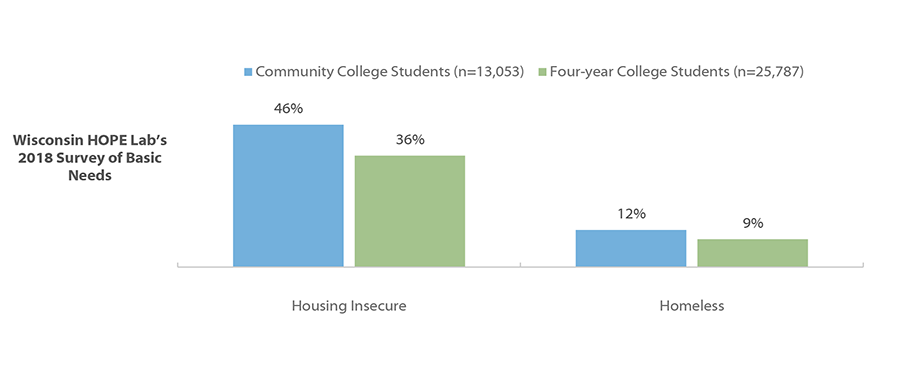
Recent studies by Trellis and the HOPE Center for College, Community, and Justice have found similar, high levels of housing insecurity and homelessness among college students. Being homeless or “without a place to live, often residing in a shelter, an automobile, an abandoned building, or outside” can make an already challenging college experience even more difficult. Housing insecurity, including inability to pay full housing costs and moving in with others due to financial issues, is less severe, but can also make the college experience difficult. As the cost of college rises, basic needs security may become a barrier to success for more students. Some colleges are addressing housing issues with emergency grants, temporary housing, and partnerships with local organizations to provide rental assistance to students.
Trellis’ Fall 2018 Student Financial Wellness Survey found 47 percent of community college students and 42 percent of four-year college students experienced housing insecurity in the previous 12 months. The Trellis study found that 11 percent of community college students and eight percent of four-year students experienced homelessness in that same time period. The survey was open to any college that wanted to participate, and of the 58 colleges in the study, 37 were community colleges and 21 were four-year institutions. The 2018 study by the HOPE Center for College, Community, and Justice found similar results as Trellis’ Student Financial Wellness Survey.
Sources: Klepfer, K. Cornett, A. Fletcher, C. & Webster, J. Student Financial Wellness Survey: Fall 2018 Unpublished Tables. Trellis Research; Goldrick-Rab, S., Richardson, J., Schneider, J., Hernandez, A., & Cady, C. (2018). Still Hungry and Homeless in College. Wisconsin HOPE Lab. https://hope4college.com/wp-content/uploads/2018/09/Wisconsin-HOPE-Lab-Still-Hungry-and-Homeless.pdf; U.S. News and World Report (February 27, 2018). A New Focus on College Campuses: Ending Housing Insecurity. https://www.usnews.com/news/education-news/articles/2018-02-27/campus-focus-on-solving-housing-insecurity-helping-homeless-students.
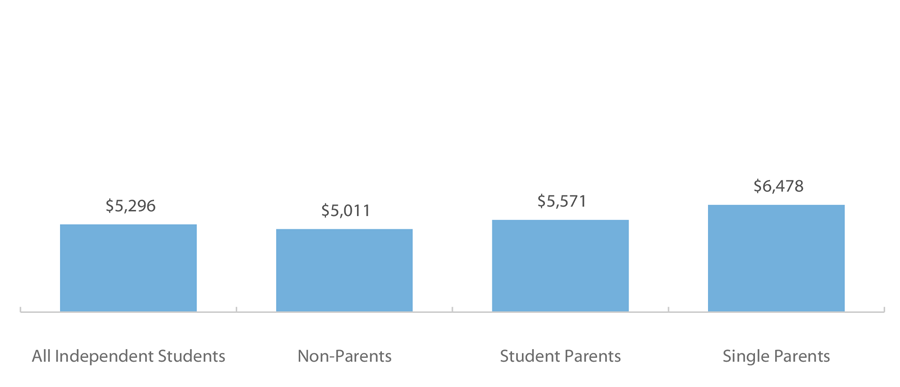
Average Unmet Need* For AY 2011-12 Among Independent College Students Nationally by Dependency, Parental, and Marital Status
Percent Completing a Degree or Certificate Within Six Years (2011-12)
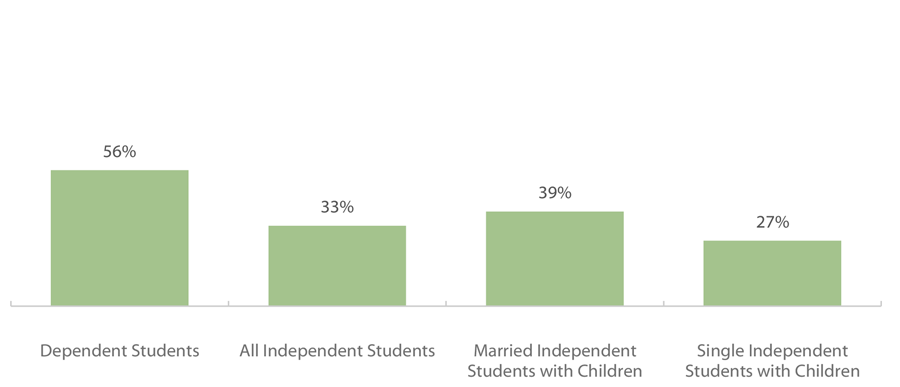
Taking care of children while trying to earn a degree can be challenging. According to an analysis of Academic Year (AY) 2011-12 U.S. Department of Education data by the Institute for Women’s Policy Research, around 4.8 million students (26% of all students) are parents with dependent children. Students with children have, on average, around $560 more in unmet need* than other independent students, and single parents have almost $1,500 more in unmet need.* Students who are single parents have a lower six-year graduation rate (27%) than other independent students (33%), much lower than married students with children (39%). Nearly 8 in 10 single parents attending college are single mothers.
Most independent students worked while attending college in AY 2011-12 (more than two thirds), and 31 percent of independent students worked full time while enrolled. While working can help relieve financial stress, working an excessive number of hours while enrolled in college can hinder class attendance and studying, and can reduce the chances of graduating.
* Unmet need is the gap that remains between a student’s resources and his/her total cost of attendance even after accounting for grants, federal loans, and expected family contribution (the formulaically-determined amount that the student can be expected to pay out of pocket).
Sources: Understanding the New College Majority: The Demographic and Financial Characteristics of Independent Students. (February 2018). Institute for Women’s Policy. Retrieved at: https://iwpr.org/wp-content/uploads/2018/02/C462_Understanding-the-New-College-Majority_final.pdf.
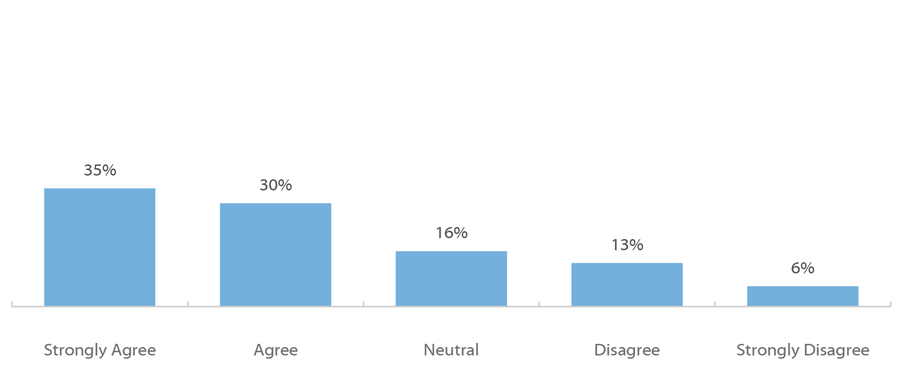
Fall 2018 Student Financial Wellness Survey
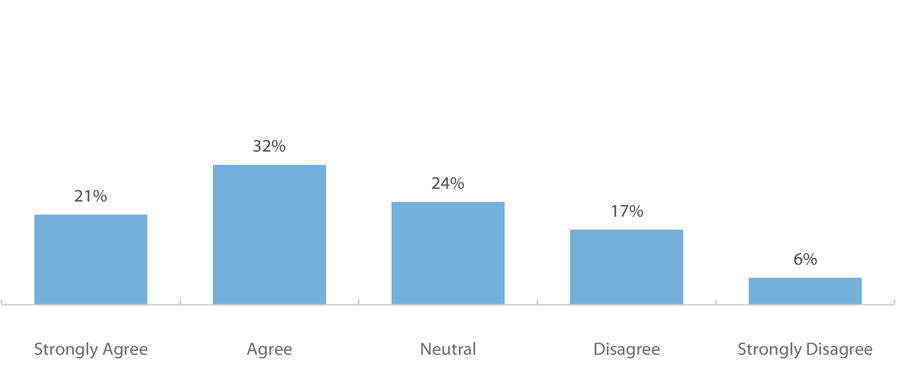
Q52: I worry about having enough money to pay for school. (n=15,994)
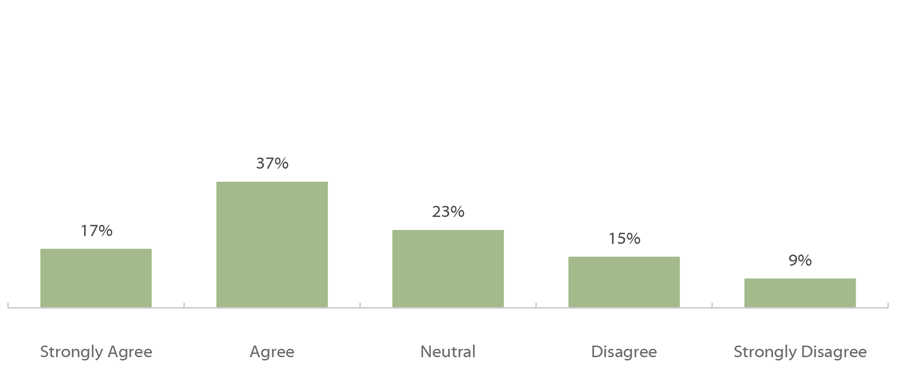
Fall 2018 Student Financial Wellness Survey
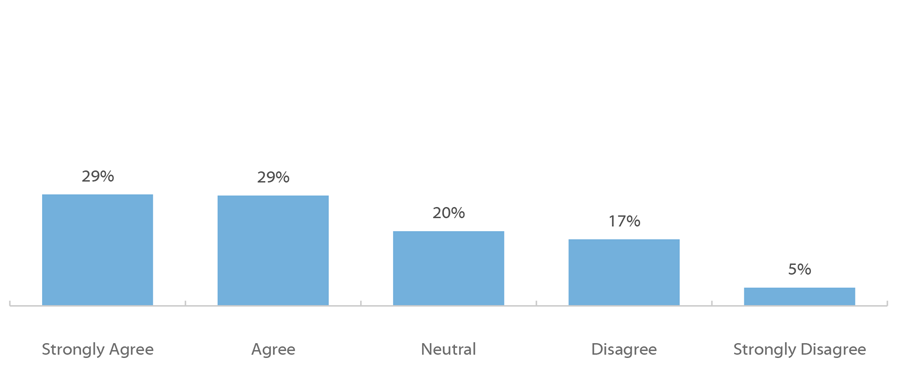
Q53: I know how I will pay for college next semester. (n=15,967)
There is growing recognition that the interplay of student collegiate finances and academic performance influences key student outcomes like retention and graduation. It is common practice for a student to develop an academic plan for college, but often there is no accompanying financial plan to help the student plan for the high direct and indirect costs of college. With these costs, those students with financial challenges may find themselves unsure of whether they can or should re-enroll in their next semester.
In Trellis’ Fall 2018 Student Financial Wellness Survey, many students surveyed signaled concerns about being able to afford college. Almost two in three respondents either agreed (30 percent) or strongly agreed (35 percent) that they worry about having enough money to pay for school. Almost a quarter of respondents (24 percent) disagreed or strongly disagreed that they knew how they would pay for college next semester. The survey was open to any college that wanted to participate, and of the 58 colleges in the study, 37 were community colleges and 21 were four-year institutions.
Sources: Klepfer, K. Cornett, A. Fletcher, C. & Webster, J. Student Financial Wellness Survey: Fall 2018 Unpublished Tables. Trellis Research.
Fall 2018 Student Financial Wellness Survey
Q45: Would you have trouble getting $500 in cash or credit in order to meet an unexpected need within the next month? (n=16,059)
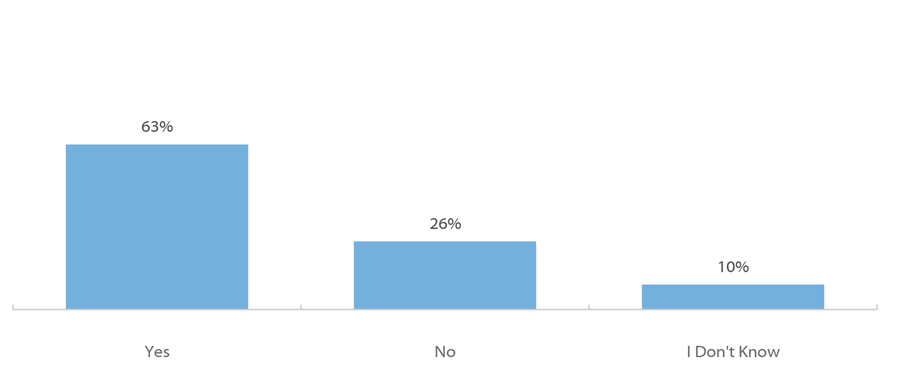
For students on tight budgets, persisting in school often depends on financial plans that go smoothly, as even modest disruptions due to accidents, illness, or unanticipated expenses can impede success. Cash-strapped students face these contingencies with fewer options than their more affluent peers, often engaging in extreme frugality and untenable work schedules that threaten their health and diminish their learning experiences. For students who are financially vulnerable, a relatively small expense can force difficult decisions around staying enrolled in college.
Nearly two-thirds of respondents (63 percent) from Trellis’ Fall 2018 Student Financial Wellness Survey indicated they would have trouble getting $500 in cash or credit in an emergency. The survey was open to any college that wanted to participate, and of the 58 colleges in the study, 37 were community colleges and 21 were four-year institutions. Given students’ financial vulnerability and lower confidence in paying for college, student success initiatives could benefit from financial components such as emergency aid programs that provide small dollar grants to students in financial emergencies. These types of interventions have improved student retention.
Source: Klepfer, K. Cornett, A. Fletcher, C. & Webster, J. Student Financial Wellness Survey: Fall 2018 Unpublished Tables. Trellis Research; Kruger, K., Parnell, A., & Wesaw, A. 2016. “Landscape analysis of emergency aid programs.” National Association of Student Personnel Administrators (NASPA). https://www.naspa.org/images/uploads/main/Emergency_Aid_Report.pdf.
Fall 2018 Student Financial Wellness Survey
Q51: I worry about being able to pay my current monthly expenses. (n=16,004)
Fall 2018 Student Financial Wellness Survey
Q46: In the past 12 months, how many times did you run out of money? (n=16,035)
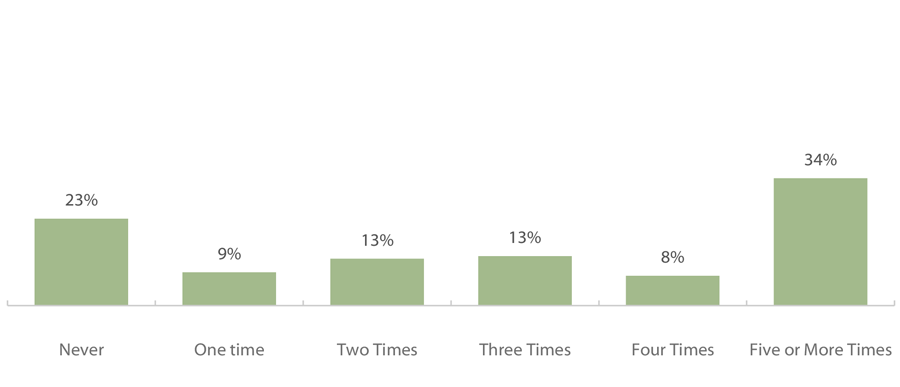
Some of the anxiety around paying for school may be driven by students’ concern for their day-to-day expenses. More than half of respondents in Trellis’ Fall 2018 Student Financial Wellness Survey worried to some degree about paying for their current monthly expenses (53 percent agree or strongly agree).
It takes careful planning for students to meet their expenses and manage a limited, often uncertain, cash flow while attending school. More than three-quarters of respondents (77 percent) reported running out of money at least once in the past 12 months, and more than half (55 percent) reported running out of money three or more times. Alarmingly, more than a third of respondents (34 percent) reported running out of money five or more times over the past year. The Student Financial Wellness Survey was open to any college that wanted to participate, and of the 58 colleges in the study, 37 were community colleges and 21 were four-year institutions.
Sources: Klepfer, K. Cornett, A. Fletcher, C. & Webster, J. Student Financial Wellness Survey: Fall 2018 Unpublished Tables. Trellis Research.
Fall 2018 Student Financial Wellness Survey
Q69: I have more student loan debt than I expected to have at this point. (of respondents with student loans, n=6,323)
Fall 2018 Student Financial Wellness Survey
Q70: How confident are you that you will be able to pay off the debt acquired while you were a student? (of respondents with student loans, n=6,329)
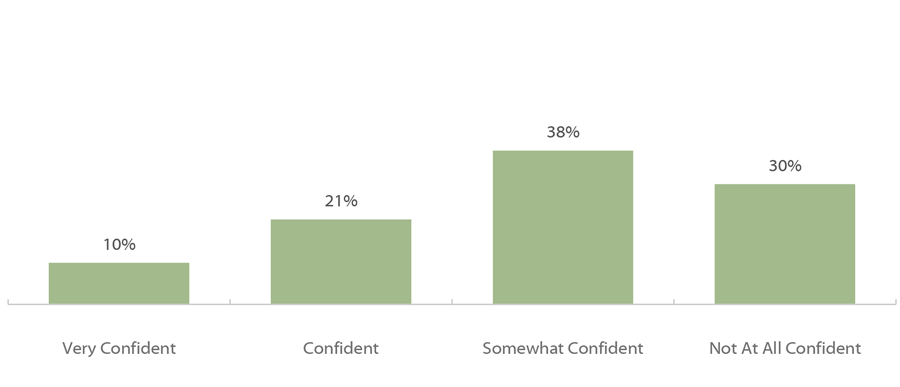
Paying for college often involves piecing together money from a variety of sources, including federal, state, institutional, and private grants, family support, personal income, savings, and various loan products. Research indicates that half of all students borrow in their first year of college, and half of the remaining students borrow within six years of enrolling.
Estimating college expenses can be difficult, especially for students who are the first in their families to attend college. More than half of respondents (58 percent) in Trellis’ Fall 2018 Student Financial Wellness Survey who borrowed agreed or strongly agreed with the statement that they had more student loan debt than they expected at this point. Many students borrow with no confidence in their ability to repay. More than two-thirds of respondents who borrowed were not at all confident (30 percent) or only somewhat confident (38 percent) they would be able to pay off the debt acquired while they were a student. The Student Financial Wellness Survey was open to any college that wanted to participate, and of the 58 colleges in the study, 37 were community colleges and 21 were four-year institutions.
Source: Klepfer, K. Cornett, A. Fletcher, C. & Webster, J. Student Financial Wellness Survey: Fall 2018 Unpublished Tables. Trellis Research; Gladieux, L., & Perna, L. (2005). “Borrowers Who Drop Out: A Neglected Aspect of the College Student Loan Trend.” The National Center for Public Policy and Higher Education.
Percentage of Undergraduates Nationally Who Carry a Credit Card Balance by Institution Sector (AY 2007-2008, AY 2011-2012, AY 2015-2016)
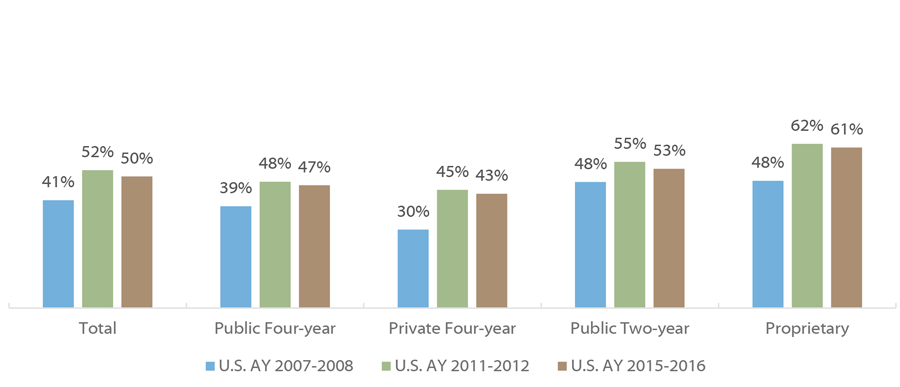
Students at public two-year and at proprietary institutions were more likely to carry a credit card balance compared to students attending four-year public or nonprofit institutions. Undergraduates in all sectors were considerably more likely to carry credit card debt in award year (AY) 2011-2012 and AY 2015-2016 than in AY 2007-2008. This increase likely has several causes: more expensive tuition costs, reductions in funding for state and institutional aid programs, and economic factors like low wages. As of AY 2011-2012, 52 percent of undergraduates nationally carried balances on their credit cards.