
State of Student Aid in Texas – 2018
Texas, National Three-year Cohort Default Rates*
(FY 2010–2014)
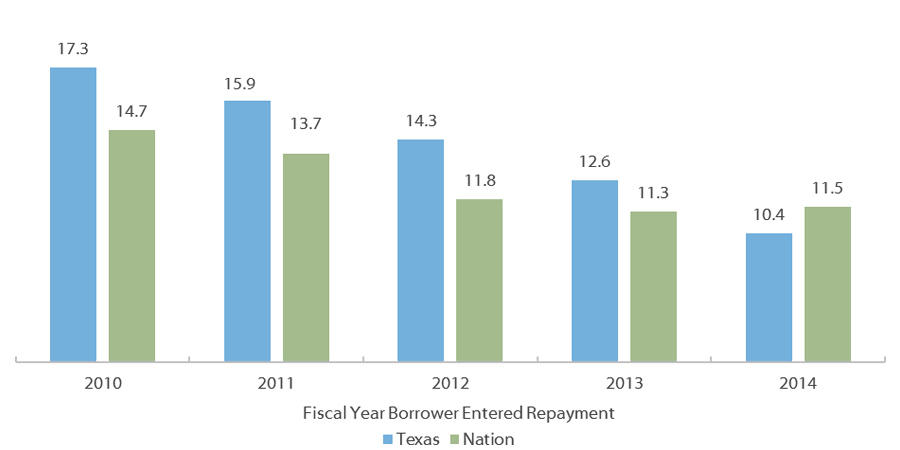
The Higher Education Opportunity Act (HEOA) of 2008 redefined cohort default rates (CDRs) to cover a three-year period (as opposed to the previous two) and thus capture more borrowers who default. Publication of the new three-year rates began in 2012 for the cohort of borrowers who entered repayment on their loans in FY 2009. The Texas three-year CDR for the FY 2009 cohort was 16.1 percent, 2.7 percentage points higher than the national three-year CDR at 13.4 percent. The CDR for both Texas and the nation increased in FY 2010 before decreasing for the last three fiscal years. In FY 2014, the rate for Texas decreased by 2.2 percentage points from the previous fiscal year while the national rate increased by 0.2 percentage points. Texas has a lower CDR than the nation for the first time.
While the precise reason(s) for the recent decline in the Texas CDR is not known, past evidence and other recent trends suggest it may have been caused at least partially by general economic improvement (particularly the falling unemployment rate) and increased usage of repayment flexibility options like income-driven repayment plans. The federal government and many institutions have made new efforts to inform borrowers of these repayment plans, which cap monthly payments at a percentage of income and require no payments at all below a certain income threshold. These efforts may be partially responsible for the declining default rate.
*A three-year cohort default rate is the percentage of student borrowers with loans entering repayment in a given fiscal year who default on their obligations during that given fiscal year or in the next two fiscal years that follow. The FY 2014 cohort default rate, for example, is based on student borrowers who entered repayment during FY 2014 and subsequently defaulted by the end of FY 2016.
Sources: U.S. Department of Education, Fiscal Year Three-Year Official Cohort Default Rates, Washington, D.C., 2017.
Three-year Cohort Default Rates* (FY 2014)
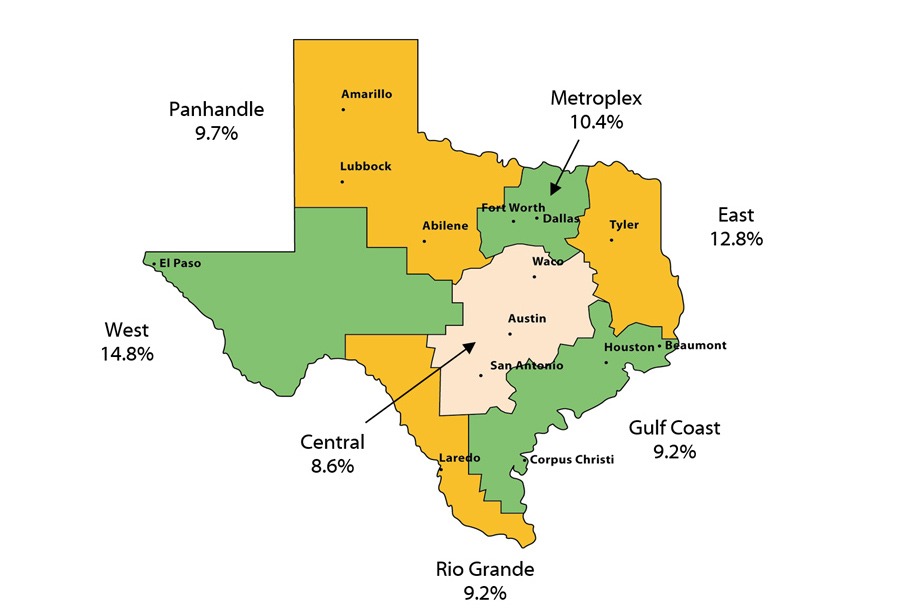
The overall Fiscal Year (FY) 2014 three-year cohort default rate (CDR) for Texas was 10.4 percent (compared to 12.6 percent in FY 2013). Texas’ FY 2014 CDR was 1.1 percentage points lower than the 11.5 default rate for the nation.
Cohort default rates vary substantially from region to region, from a high of 14.8 percent in the West Texas region to a low of 8.6 percent in the Central Texas region. All of the Texas regions experienced a decrease in the three-year default rates between FY 2013 and FY 2014 except for the West Texas region, where the CDR increased from 14.2 percent to 14.8 percent. The largest difference was seen for schools in the Rio Grande Valley region, where the three-year CDR dropped four percentage points between FY 2013 and FY 2014, continuing a trend of from a high of 20.5 percent in FY 2010. All regions have seen their rates drop since FY 2010, likely due in part to recovery from the economic recession.
*A three-year cohort default rate is the percentage of student borrowers with loans entering repayment in a given fiscal year who default on their obligations during that given fiscal year or in the next two fiscal years that follow. For example, the FY 2014 cohort default rate is based on student borrowers who entered repayment during FY 2014 and subsequently defaulted by the end of FY 2016.
Sources: U.S. Department of Education, Fiscal Year 2013 and Fiscal Year 2014 Three-Year Official Cohort Default Rates, Washington, D.C., 2017.
Texas Three-year Cohort Default Rates* by School Type
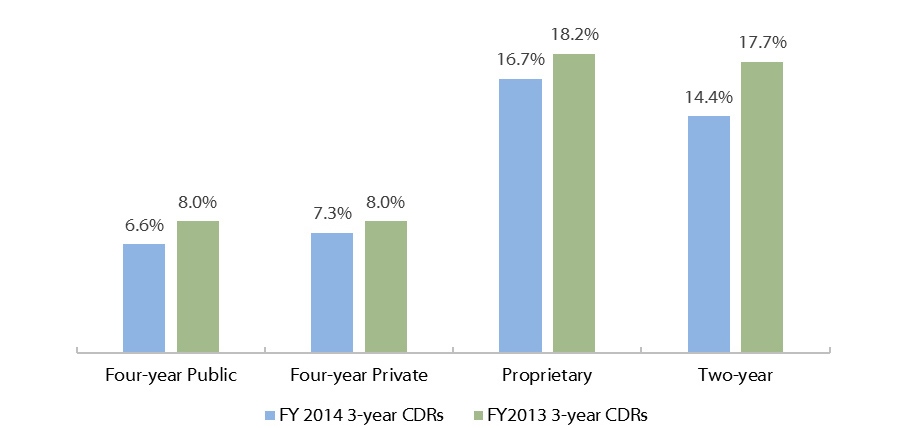
Texas borrowers who attended short-term programs have a combined FY 2014 three-year cohort default rate (CDR) more than twice the rate of those who attended four-year schools (15.1 percent and 6.7 percent, respectively). Although some proprietary schools offer bachelor’s degrees or higher, most proprietary schools in Texas offer short-term programs exclusively. At 16.7 percent, the highest FY 2014 three-year CDR is for the proprietary sector, followed closely by the two-year sector with a 14.4 percent CDR. This is a minor reversal compared to the nation as a whole, where the proprietary sector had a 15.5 percent CDR (17.5 percent for 2-3-year programs) and the public two-year sector had an 18.3 percent CDR. All sectors in Texas had a decrease in their rate from FY 2013 to FY 2014, with a particularly large decrease in the two-year sector of over three percentage points.
There are several factors that contribute to the tendency toward higher CDRs for short-term programs, as compared to four-year schools. For example, borrowers from short-term programs are more likely to have risk factors for dropping out of school, such as attending school part time and working full time, than are students from four-year colleges and universities.
*A three-year cohort default rate is the percentage of student borrowers with loans entering repayment in a given fiscal year who default on their obligations during that given fiscal year or in the next two fiscal years that follow. The FY 2014 cohort default rate, for example, is based on student borrowers who entered repayment during FY 2014 and subsequently defaulted by the end of FY 2016.
Sources: Cohort Default Rates: U.S. Department of Education, Fiscal Year 2014 Official Cohort Default Rates, Washington, D.C., 2016; All Other: U.S. Department of Education, National Center for Education Statistics, “National Postsecondary Student Aid Study (NPSAS) 2012” (http://www.nces.ed.gov/das/).
Student Loan Debt Balance per Capita by State
2017 Q4
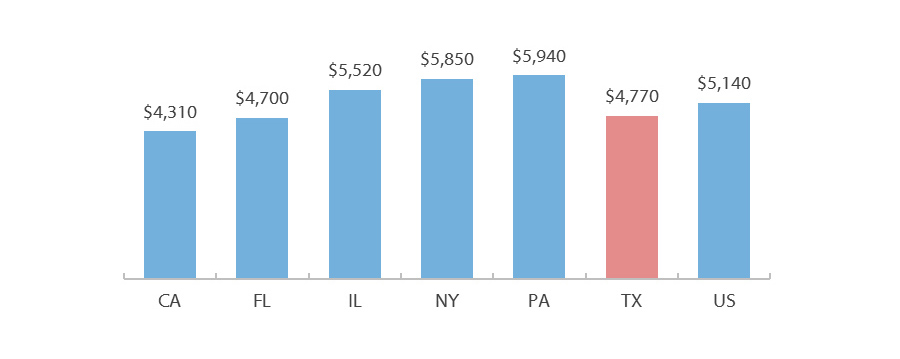
In the last quarter of 2017, Texans had a per capita student loan debt balance of about $4,770, lower than the national balance of $5,140. Texas has the third lowest student loan debt balance among the six largest states. Student loans in this analysis include loans to finance educational expenses provided by banks, credit unions and other financial institutions as well as federal and state governments.
Debt Balance per Capita by State
2017 Q4
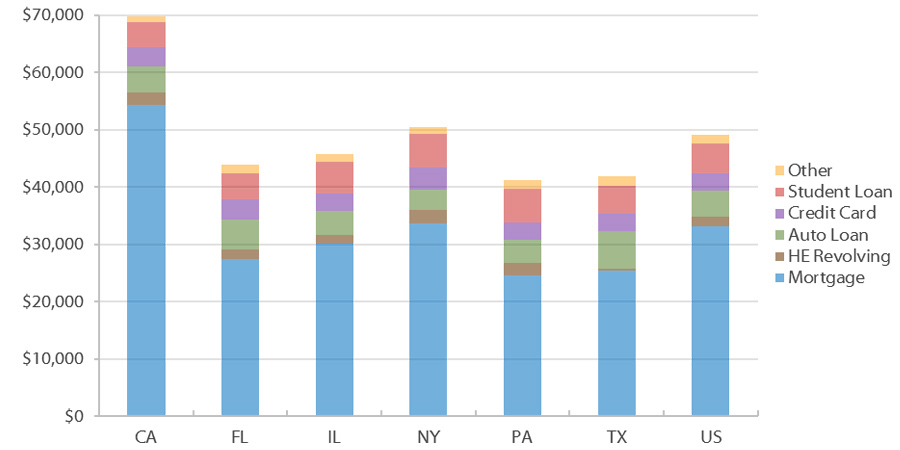
With a per capita average of $41,900 in debt, Texans have the second lowest debt balance among the six largest states and the national average. This debt profile includes mortgage accounts, home equity revolving accounts, auto loans, bankcard or credit card accounts, student loans, and other loans (such as consumer finance and retail loans).
Sources: Federal Reserve Bank of New York, The Center for Microeconomic Data, Data & Reports, 2017 Q4 (https://www.newyorkfed.org/microeconomics/data.html).
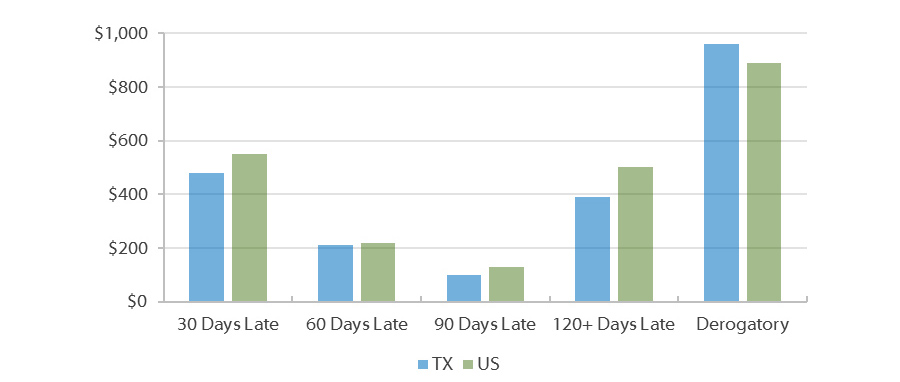
Delinquency Status of Debt per Capita by State
2017 Q4
Percentage of Balance 90+ Days Late by State
2016 and 2017
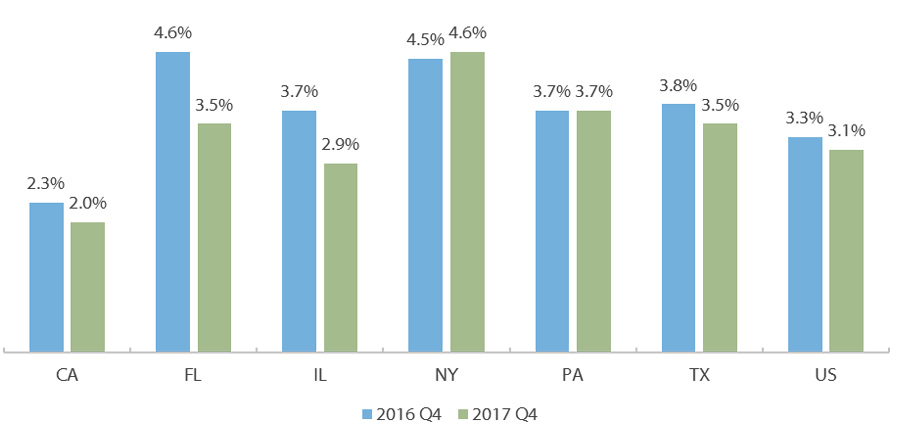
The amounts of debt in each stage of delinquency were not very different when comparing Texas and the US. Overall in the US and in most of the six largest states, the percentage of the debt balance that is severely delinquent – that is, 90 or more days late – had decreased by the end of 2017 compared to the end of 2016. Texas tied for the third lowest percentage of severely delinquent borrowers among the six largest states, but still higher than the overall US percentage.
Note: The Derogatory delinquency status includes a person with any level of delinquency combined with repossession, charge off to bad debt, or foreclosure.
Source: Federal Reserve Bank of New York, The Center for Microeconomic Data, Data & Reports, 2017 Q4 (https://www.newyorkfed.org/microeconomics/data.html).
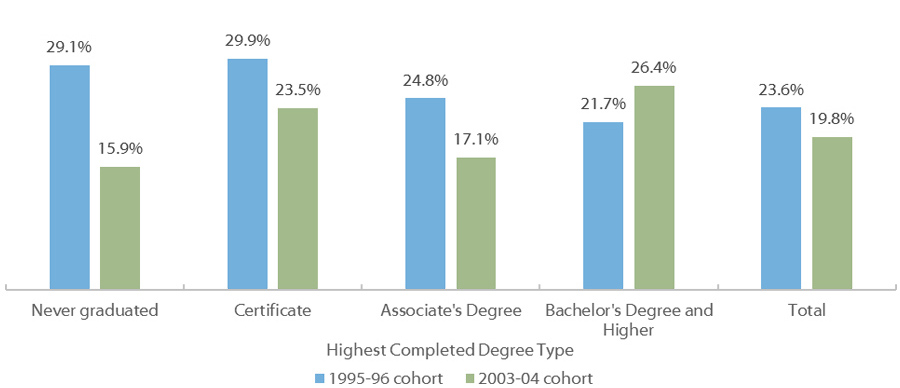
Percentage of Borrowers Who Defaulted within 12 Years of Starting College, by
Degree Type
1995-96 and 2003-04 Cohorts
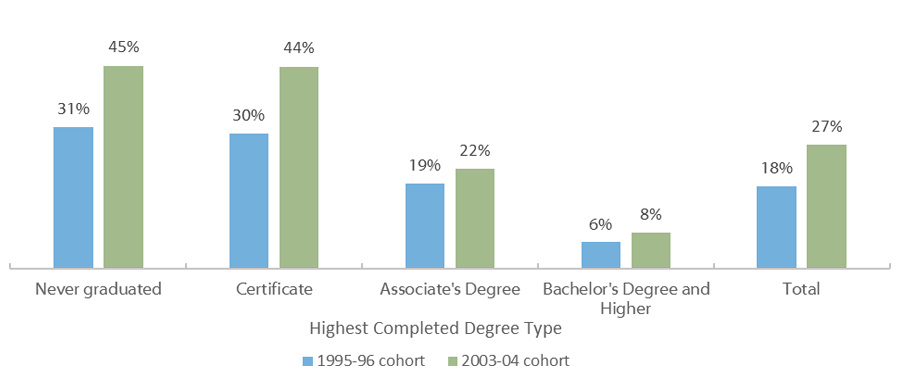
Approximately 31 percent of all student borrowers who first started their postsecondary education in the 1995-96 academic year and did not graduate had defaulted sometime during the 12 years after first starting college. A nearly identical percentage of certificate earners also defaulted during that timeframe. The default rates for associate’s degree and bachelor’s degree holders were lower. Just under six percent of borrowers who earned a bachelor’s degree or higher had defaulted on their loans in the 12-year timeframe.
The default rates for borrowers who first started college in the 2003-04 academic year were higher across all categories, particularly among certificate holders and those who never graduated. This is likely due in part to the 2007-08 economic recession that would have hit many of those borrowers early in their work life following college. Those with less education have higher unemployment rates than those with more, and this was certainly true during and following the recession.
There are several factors that contribute to the tendency toward higher default rates for short-term programs, such as certificate programs and associate’s degrees, as compared to four-year schools. For example, borrowers from short-term programs are more likely to have risk factors for dropping out of school, such as attending school part time and working full time, than are students from four-year colleges and universities.
When the timeframe for tracking the 1995-96 cohort was extended from 12 to 20 years, 25.4 percent of all student borrowers had defaulted. The more recent cohort has already exceeded that rate at just the 12-year mark.
Sources: Default Rates: U.S. Department of Education, National Center for Education Statistics, Repayment of Student Loans as of 2015 Among 1995-96 and 2003-04 First-Time Beginning Students, October 2017 (https://nces.ed.gov/pubsearch/pubsinfo.asp?pubid=2018410); Risk Factors: U.S. Department of Education, National Center for Education Statistics, “National Postsecondary Student Aid Study (NPSAS) 2012” (http://www.nces.ed.gov/das/); Unemployment Rates: Bureau of Labor Statistics. “Employment Status of the Civilian Population 25 Years and Over by Educational Attainment,” March 2018 (https://www.bls.gov/news.release/empsit.t04.htm).
Percentage of Borrowers Who Fully Paid Back Loans without Defaulting within 12 Years of Starting College
1995-96 and 2003-04 Cohorts
About a quarter of all borrowers among those who first began postsecondary education in the 1995-96 academic year had fully repaid their federal loans without defaulting within 12 years of starting college. The fully repaid percentage is higher among the less educated and lower among the more educated. This is likely because those with higher levels of education are usually in school for longer, so they would not start repayment on their loans until later, leaving fewer years out of the 12 in which to fully repay. Additionally, those with higher levels of education are more likely to borrow higher amounts compared to those with lower levels of education.
Across nearly all categories, borrowers who first began postsecondary education in the 2003-04 academic year had lower rates of fully repaying their federal loans without defaulting within 12 years of starting college compared to those who first started in the 1995-96 academic year. The exception is the group of borrowers who earned a bachelor’s degree or higher – these borrowers had the highest repayment rate among all the categories in the 2003-04 cohort of borrowers. In the 1995-96 cohort of borrowers, the bachelor’s degree or higher group of borrowers had the lowest repayment rate among all the categories.
This reversal may be related to the 2007-08 economic recession that would have hit many of the 2003-04 cohort of borrowers early in their work life following college. Although unemployment rates rose for everyone during the recession, the rates remained lower for those with higher levels of education. It may be that those with a bachelor’s degree or higher were better able to secure and maintain employment during and following the recession compared to those with lower levels of education, making full repayment more likely.