
State of Student Aid in Texas – 2018
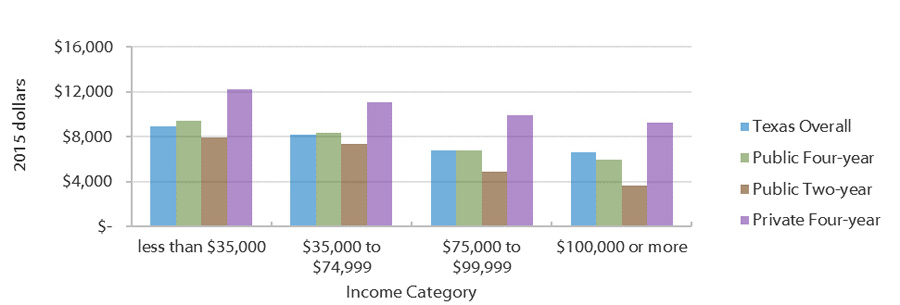
Average Unmet Need for Students in Texas by Income Category and Sector (Fall 2015)
Average EFC for Students in Texas by Income Category and Sector (Fall 2015)
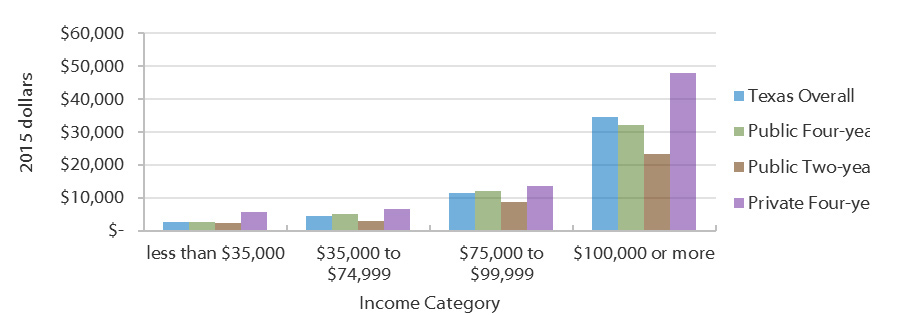
Unmet need is defined as a student’s cost of attendance* minus his or her expected family contribution (EFC)** and all financial aid including grants, scholarships, work-study, and loans. This is the amount that students and/or their families must cover over and above their EFC, which is also an out-of-pocket expense.
The lowest-income students in Texas tend to have the highest unmet need; in 2015, average unmet need for this group was about $8,889 statewide. At private four-year schools, this group experienced average unmet need of over $12,000. Besides having greater financial resources to contribute to EFC, those in the highest income category are more likely to attend more expensive four-year institutions, which further increases EFC. Data on students who attended proprietary institutions are not available.
* Estimated sum of tuition and fees, books and supplies, food and housing, transportation, and other expenses for a full-time student for nine months.
** EFC is determined through a federal formula that considers family size, income, and the number of children in college, among other factors. It is considered a rough estimate of a reasonable, affordable annual payment for a family with a given set of circumstances.
Sources: Texas Higher Education Coordinating Board (THECB), “Unmet Need and Expected Family Contribution” (unpublished tables).
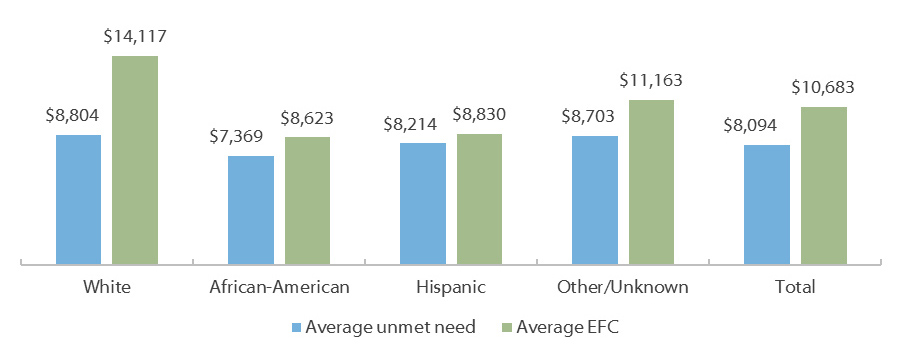
Average Unmet Need and Average EFC* by Race/Ethnicity for Texas Public Institutions, Public Four-Year (Fall 2015)
Average Unmet Need and Average EFC* by Race/Ethnicity for Texas Public Institutions, Public Two-Year (Fall 2015)
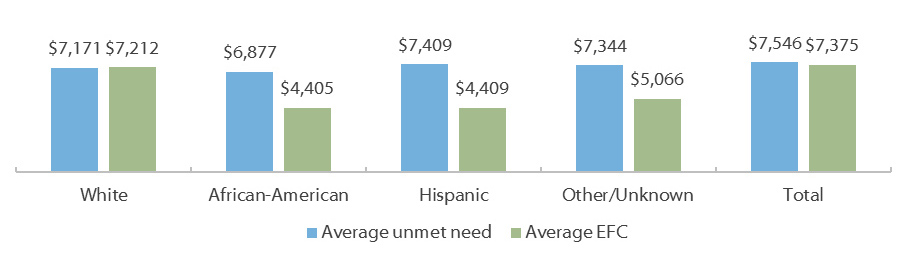
Despite substantially lower cost of attendance at public two-year schools, unmet need* is not significantly lower on average for students at these institutions compared to students at public four-year institutions. For all racial/ethnic groups, average expected family contribution (EFC)** was much higher at four-year universities due to a higher cost of attendance and a larger concentration of students from higher income families. Higher income students are disproportionately White or in the “Other/unknown” category, which explains the higher EFC amounts for those racial/ethnic groups. This is particularly evident at public four-year schools, where students in these racial/ethnic groups are not only wealthier on average but also more likely to enroll at higher cost universities.
* “Unmet need” is the gap that remains between a student’s resources and his/her total cost of attendance even after accounting for both grant and loan aid and EFC.
**EFC is the formulaically determined amount that the student can reasonably be expected to pay out of pocket.
Sources: Texas Higher Education Coordinating Board (THECB), “Unmet Need and Expected Family Contribution” (unpublished tables).
Percentage of Undergraduates Who Carry a Credit Card Balance by Institution Sector (AY 2007-2008, AY 2011-2012)
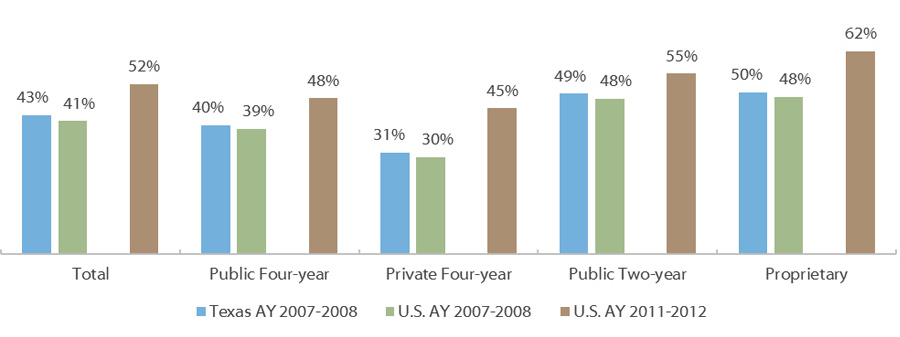
Both nationally and in Texas, students at public two-year and at proprietary institutions were more likely to carry a credit card balance, followed by students at public four-year and private four-year institutions. Undergraduates in all sectors nationally were considerably more likely to carry credit card debt in award year (AY) 2011-2012 than in AY 2007-2008. This increase likely has several causes: more expensive tuition costs, reductions in funding for state and institutional aid programs, and economic factors like low wages. As of AY 2011-2012, 52 percent of undergraduates nationally carried balances on their credit cards. Given that Texas undergraduates carried credit card balances at slightly higher rates than the national average in AY 2007-2008, it is likely that more than half of Texas undergraduates carried credit card balances as of AY 2011-2012.
*Data for Texas for AY 2011-2012 are unavailable.
Sources: U.S. Department of Education, National Center for Education Statistics, “National Postsecondary Student Aid Study (NPSAS) 2008” and “National Postsecondary Student Aid Study (NPSAS) 2012” (http://www.nces.ed.gov/das/).
Hours of Minimum Wage Work per Week Needed to Pay for an Average Texas Public University Undergraduate Education (2000 to 2016)
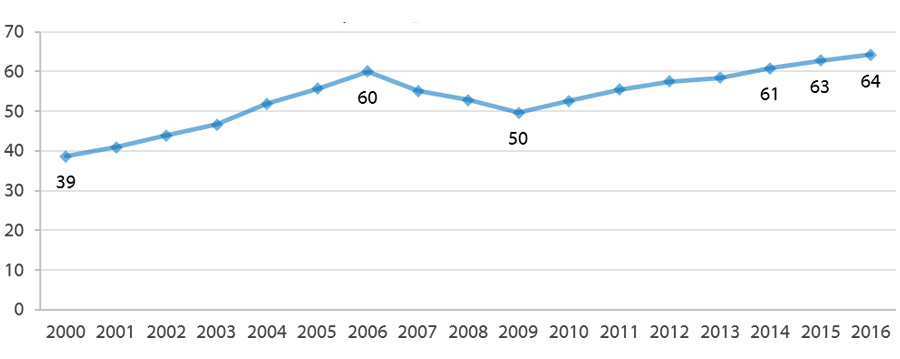
In earlier decades, many students financed an undergraduate education by taking a full course load while working enough hours to cover living and educational expenses, perhaps with the aid of savings from a full-time summer job. From 1966 to 1981, a time in which the minimum wage increased fairly regularly, an industrious undergraduate could have paid for a year of education at a public university — including tuition, food, and housing — by working about 24 hours per week at a minimum wage job.
In the early 1980s, as the cost of education began to climb and the minimum wage increased less frequently, the number of work hours needed to pay for an education began to rise. By 1989, students earning the then-minimum wage of $3.35 per hour had to work 39 hours per week to cover the national average undergraduate budget. The hours needed to pay for an undergraduate education continued to inch upward in the 1990s, then rose again sharply at the turn of the century. The national average has since climbed to all-time high of 70 hours per week as of 2016.
The cost of attendance tends to be lower in Texas, which means fewer hours of work per week would be needed to pay for college. In 2016-2017, an in-state, residential undergraduate would have had to work 64** hours every week of the year to pay for two semesters at a Texas public university. This is a slight increase from 2014 of 3 hours and a is a continuation of the upward trend beginning in 2010, which reflects the period of annual minimum wage increases (2006-2009) coming to an end.
*Using Postsecondary Education Opportunity methodology, the Award Year (AY) 2016–2017 average in-state student budget at a U.S. public university is estimated at $24,861. In 2016, the minimum wage was $7.25 per hour, with 6.2 percent taken out for Social Security. At a net of $6.80 per hour, a full-time student with no other financial aid or assets would have to work 3,656 hours per year, or 70 hours per week, to put him or herself through school.
**The average student budge for an in-state, residential student at a Texas public four-year university in AY 2016–2017 was $22,706. At a net of $6.80 per hour, a full-time Texas student with no other financial aid or assets would have to work 3,339 hours per year, or 64 hours per week, to put him or herself through school.