
State of Student Aid in Texas – 2018
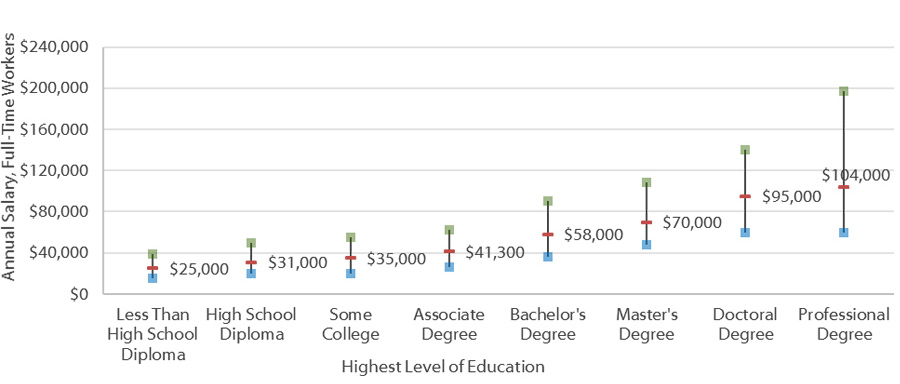
Annual Earnings, Full-Time U.S. Workers: 25th, 50th, and 75th Percentiles (2016)
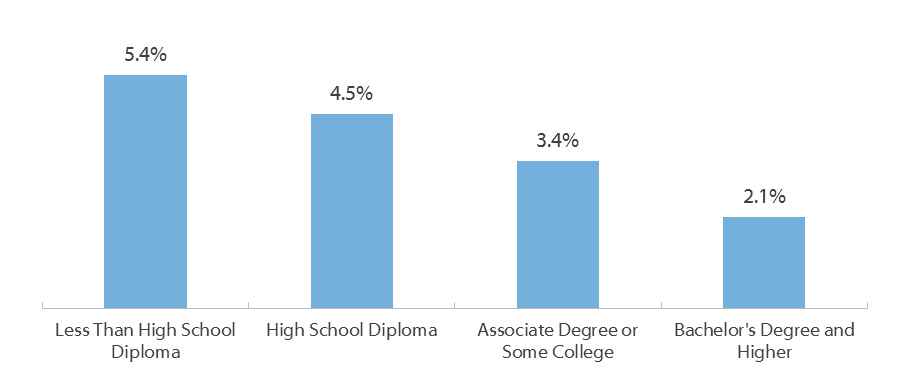
Unemployment Rate by Educational Attainment (January 2018, Seasonally Adjusted)
The U.S. Census Bureau reports that higher levels of education are typically associated with higher median earnings; however, annual incomes in the U.S. also vary widely within the same level of education. Consequently, some workers with associate degrees earn more than those with bachelor’s degrees, while other bachelor’s-level graduates make more than some master’s degree holders. While educational level is not the sole predictor of one’s income, the income range also expands as level of education increases, suggesting that workers with higher levels of education may encounter more opportunities for financial growth.
More evidence for the economic value of education comes from the U.S. Bureau of Labor Statistics. For January 2018, the unemployment rate of workers age 25 and older who had not completed high school stood at 5.4 percent. The unemployment rate for high school graduates was 4.5 percent, while the unemployment rate for those with a bachelor’s degree and higher was 2.1 percent.
Sources: Unemployment: Bureau of Labor Statistics. “Employment Status of the Civilian Population 25 Years and Over by Educational Attainment,” January 2018 (http://www.bls.gov/news.release/empsit.t04.htm); Earnings: U.S. Census Bureau, American Community Survey 2016 (http://www.census.gov/programs-surveys/acs/data/pums.html)
Lifetime Earnings, Full-Time U.S. Workers: 25th, 50th, and 75th Percentiles
(in Millions of 2016 Dollars)
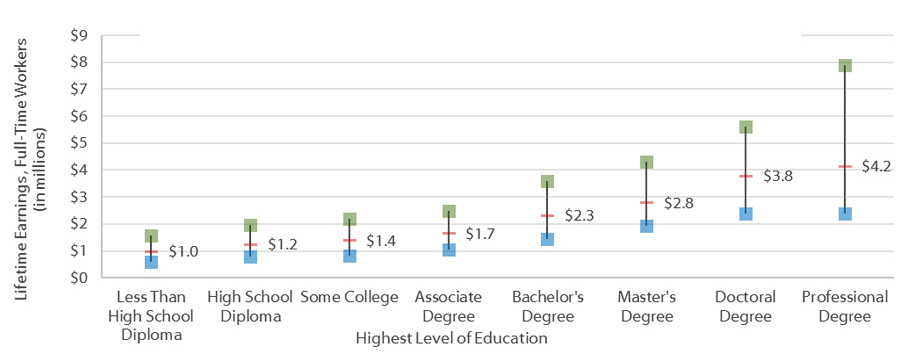
The difference in the salary earned by higher- and lower-educated workers compounds over a lifetime. The estimated earnings during the work-life (approximately 40 years) of a worker who did not complete high school is about $1 million. Completing high school increases median lifetime earnings by about $200,000, and completing a bachelor’s degree raises median lifetime earnings to $2.3 million. Post-graduate education pays off even more; workers with a professional degree, such as doctors and lawyers, can expect over the course of their work-lives to earn an additional $1.9 million over what workers with a bachelor’s degree will earn. Higher levels of education typically offer increased lifetime earnings, but they also allow for more earning variability, as shown by the wider income ranges for the higher levels of education.
Median Work-life Earnings by Level of Education and Gender (in millions of 2016 dollars)
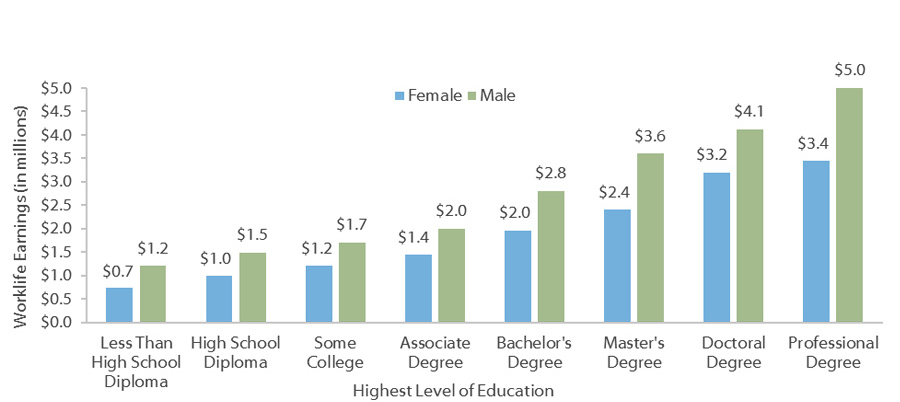
Lifetime earnings differences based on education are even more pronounced for women, who must earn at least a bachelor’s degree to make as much as men with some college or an associate degree, on average.
Sources: Earnings: U.S. Census Bureau, American Community Survey 2016 (http://www.census.gov/programs-surveys/acs/data/pums.html)
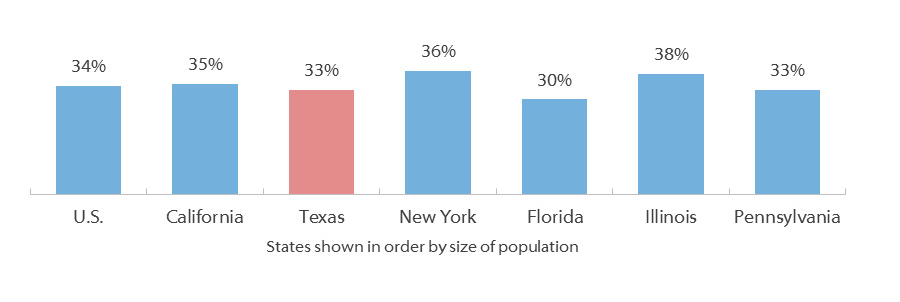
Population Age 25 and Older with a Bachelor’s Degree or Higher (2017)
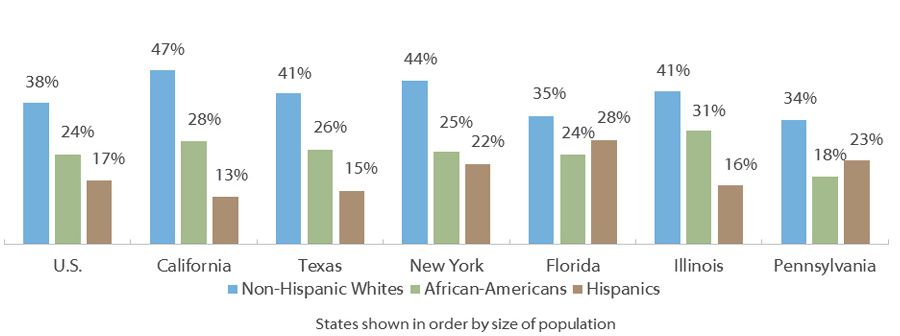
Population Age 25 and Older with a Bachelor’s Degree or Higher by Race/Ethnicity (2017)
Texas is comparable to the nation in the percentage of people who have completed a bachelor’s degree or higher. U.S. Census Bureau data show that in 2017 about 33 percent of Texans age 25 and older had obtained a bachelor’s degree or higher (the same as in 2016, but up from 29 and 31 percent in 2014 and 2015, respectively). Among the six most populous states, Texas is tied for the second lowest percentage of the overall population age 25 and older with a bachelor’s degree or higher.
By race/ethnicity, U.S. Census Bureau data also show that:
- In Texas, Hispanics are the least likely to complete a bachelor’s degree. Only 15 percent of Hispanics age 25 and older have a bachelor’s degree or higher, compared with 41 percent of Non-Hispanic Whites.
- The percentage of African-Americans in Texas who have a bachelor’s degree is 15 percentage points lower than that of Whites. This gap has decreased by 1 percentage points since 2016.
- Among the six largest states, Texas is tied for third in the percentage of Whites with a degree and ranks fifth for Hispanics.
Sources: U.S. Census Bureau, Current Population Survey 2017. Current Population Survey (CPS) Table Creator For the Annual Social and Economic Supplement (https://www.census.gov/cps/data/cpstablecreator.html).
Population Age 25 and Older with a Bachelor’s Degree or Higher (2016)
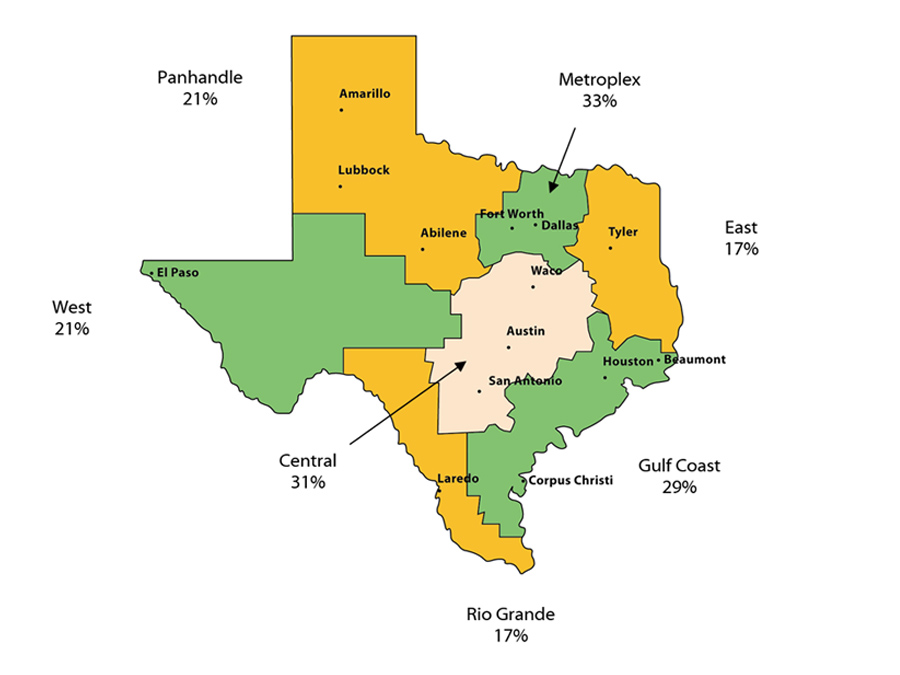
Educational attainment levels in the different regions of Texas vary dramatically. In the Metroplex region, 33 percent of people age 25 and older have a bachelor’s degree or higher. In Central Texas, home to the state’s two flagship universities, 31 percent of adults have a bachelor’s degree or higher, and in the Gulf Coast region, 29 percent have a bachelor’s degree or higher. However, educational attainment levels drop off in other areas of the state. The East Texas, West Texas, and Panhandle regions all record lower levels of educational attainment, and in the Rio Grande Valley region, the percentage of college graduates is about half that in the Metroplex region.
Sources: U.S. Census Bureau, American Communities Survey, 2016 Five-Year Estimates, Washington, D.C. (http://www.census.gov/acs/www/)
First-time Freshmen Who Entered a Texas Public University and Received a Bachelor’s Degree within Six Years, by Ethnicity
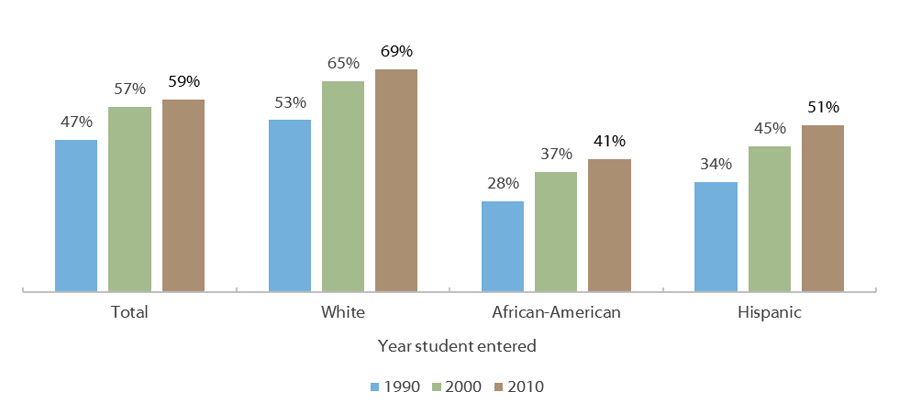
College graduation rates in Texas are rising but remain stratified by ethnicity. About 59 percent of first-time (in college), full-time freshmen who entered a Texas public university in 2010 obtained a bachelor’s degree from that or another Texas public university within six years, but the rate varied from 69 percent of Whites to 51 percent of Hispanics to 41 percent of African-Americans. The six–year graduation rates have risen over the past two decades for all racial and ethnic groups, but the rates have not increased as dramatically for African-American students as they have for White and Hispanic students.
As of Fiscal Year (FY) 2013, only 27.6 percent of freshmen in Texas graduate in four years. Most undergraduates in the U.S. take more than four years to complete a bachelor’s degree. In 2013, only 38.7 percent of students nationally completed a degree within 4 years. Reasons for this vary, but include that the student may be: 1) pursuing a degree that requires more than 120 credit hours; 2) pursuing more than one degree; 3) changing his or her degree plan or major; 4) taking extra courses beyond those needed to graduate; 5) leaving or “stopping out” of school for brief periods; or 6) transferring from one institution to another. In addition, many students may attend school part time and work long hours in order to cut costs.
Source: National 4-year Graduation rates (2013): The Chronicle of Higher Education. College Completion. https://collegecompletion.chronicle.com/state/#state=ny§or=public_four; Graduation rates: Six-year and ten-year: THECB, Baccalaureate Graduation Rates http://www.thecb.state.tx.us/reports/PDF/3409.PDF?CFID=18285142&CFTOKEN=11849287).
Percentage of Young Adults in 2015 (Ages 25-34) With a Bachelor’s Degree or Higher
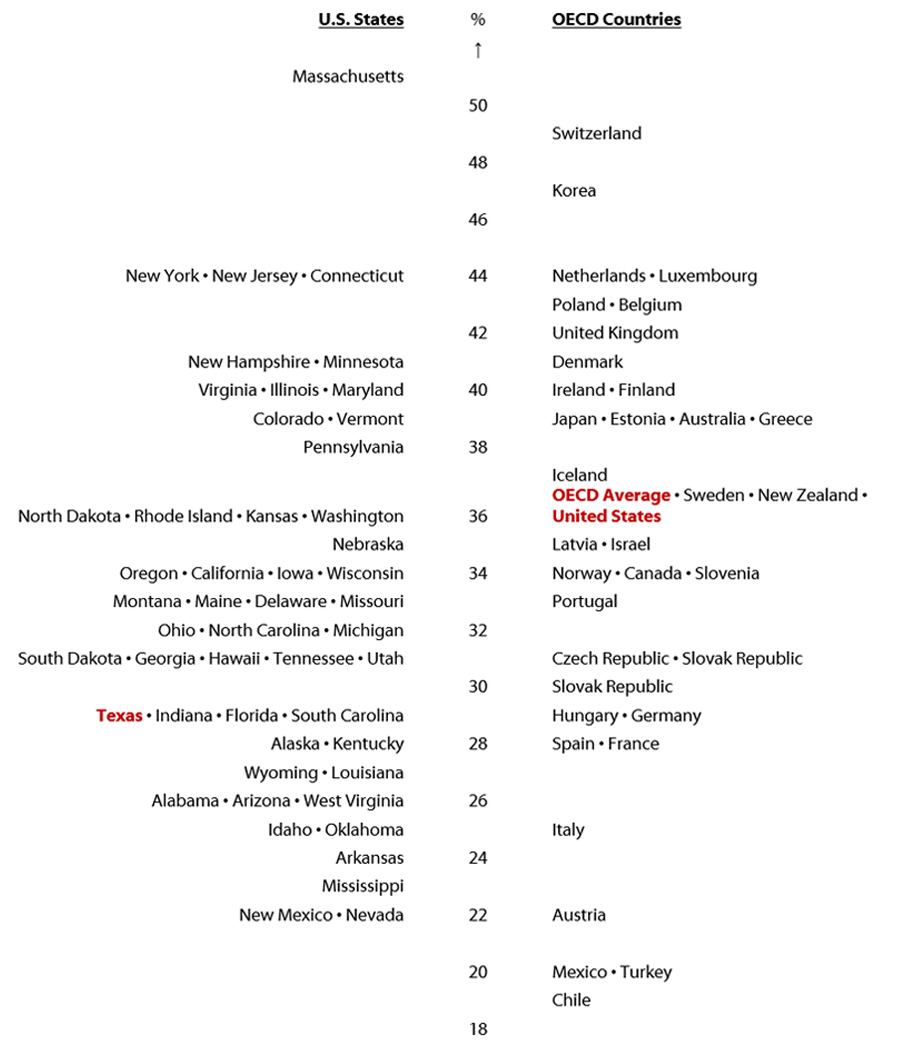
The U.S. is often compared to other countries in the Organization for Economic Co-operation and Development (OECD) when measuring educational attainment. However, within the United States, each individual state can have very different education systems. Disaggregating attainment by individual U.S. states highlights the variance between state education systems in attainment percentages. The U.S. average for young adults (ages 25-34) with a bachelor’s degree or higher is 36 percent, the same as the OECD average and 7 percentage points higher than the Texas average. These rankings can change significantly when comparing attainment levels of an associate degree or higher.
Sources: OECD (2016), Education at a Glance 2016: OECD Indicators, OECD Publishing, Paris. DOI: http://dx.doi.org/10.1787/eag-2016-en; U.S. Census Bureau, 2014 American Community Survey, 2014 Three-Year Estimates http://factfinder2.census.gov/faces/nav/jsf/pages/searchresults.xhtml?refresh=t. Note: The methodology and design for this figure was derived from the Texas Business Leadership Council and NCHEMS, 2013 TAB Higher Education Summit.
Texas Student Pipeline by Race/Ethnicity Transition Rates from 8th Grade to College Completion
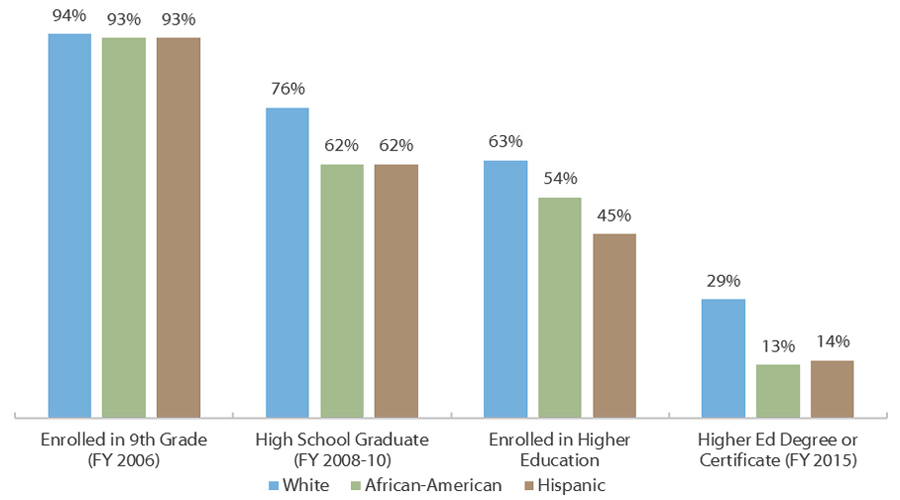
The student pipeline is one way to observe the path that Texas students take towards earning a postsecondary credential. The pipleine highlights the major transition points where many students drop out of the system. Simply focusing on student success after high school is an insufficient strategy to increase the number of postsecondary credentials. Instead, a strategy of promoting student achievement at every level of the educational pipeline has a better chance of increasing degree attainment.
At every stage of the student pipeline, larger percentages of Hispanic and African-American students exited compared to White students. Whereas 63 percent of White 8th graders in 2005 enrolled in higher education directly following high school graduation, only 54 and 45 percent of African American and Hispanic 8th graders enrolled, respectively. Reducing these disparities is essential to making the attainment gains Texas needs for a skilled and competitive workforce, because these gains will most easily be found in underserved populations. For all student groups, those who enrolled in higher education but did not complete a degree or certificate represented the largest drop-off in the student education pipeline.
Note: The methodology and design for this figure was derived from the Texas Business Leadership Council and NCHEMS, 2013 TAB Higher Education Summit
Source: Texas Higher Education Coordinating Board, Regional Topic Data Tabs: 8th Grade Cohort and HS to College Data, 2015 (http://www.txhighereddata.org/reports/performance/regions/). TEA and National Student Clearinghouse data used by THECB. Out-of-state graduate total not shown, because current NSC data collection extends only into 2006.
Debt-to-Income Ratios by Type of Credential
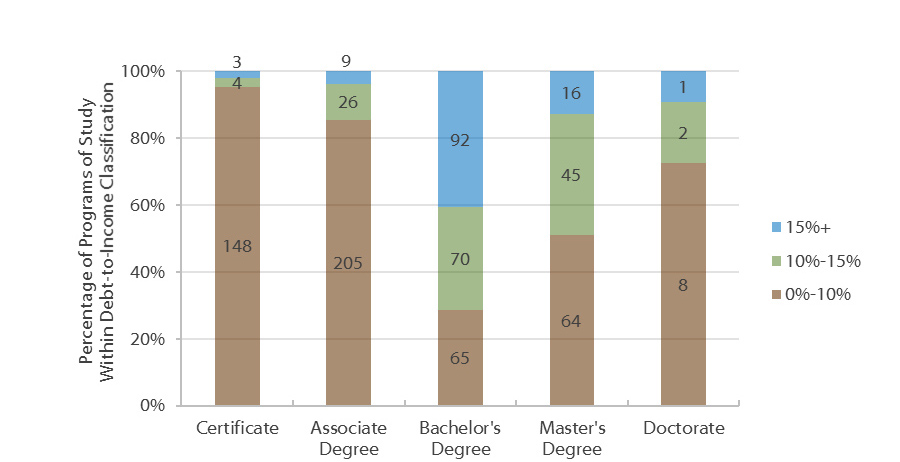
Debt-to-income ratios — comparisons of student loan debt to annual income — are becoming a more common metric to determine the potential financial burden borrowers may encounter after leaving school. Many experts recommend that annual student loan payments not exceed 15 percent of a borrower’s annual income. Based on income within the first year of graduation, certificate holders are the most likely to have debt-to-income ratios under 10 percent, followed closely by associate degree graduates. Bachelor’s degree graduates, who are typically enrolled in school for additional years, are the least likely to have ratios less than 10 percent.
| Type of Credential | Median Annual Student Loan Payment | Median Annual After-Tax Income | Average Debt-to-Income Ratio |
|---|---|---|---|
| Certificate | $1,082 | $23,896 | 5% |
| Associate Degree | $1,209 | $23,372 | 5% |
| Bachelor’s Degree | $3,698 | $26,304 | 14% |
| Master’s Degree | $4,294 | $43,500 | 10% |
| Doctorate | $3,621 | $69,836 | 5% |
| Overall | $1,878 | $27,862 | 7% |
Within the first year after graduation, annual incomes do not vary greatly by award type. However, holders of bachelor’s or graduate degrees have student loan payments that are more than double that of their certificate and associate degree counterparts. This first-year snapshot does not necessarily reflect the long-term earning potential of these graduates. Many graduates — especially those who are entering the workforce for the first time — are unemployed or underemployed. The data shown above depict the financial circumstances experienced by many new graduates in Texas.