
State of Student Aid in Texas – 2019
Total Grant Aid Awarded in Texas by Major Grant Program, by Fiscal Year (in Current Dollars)
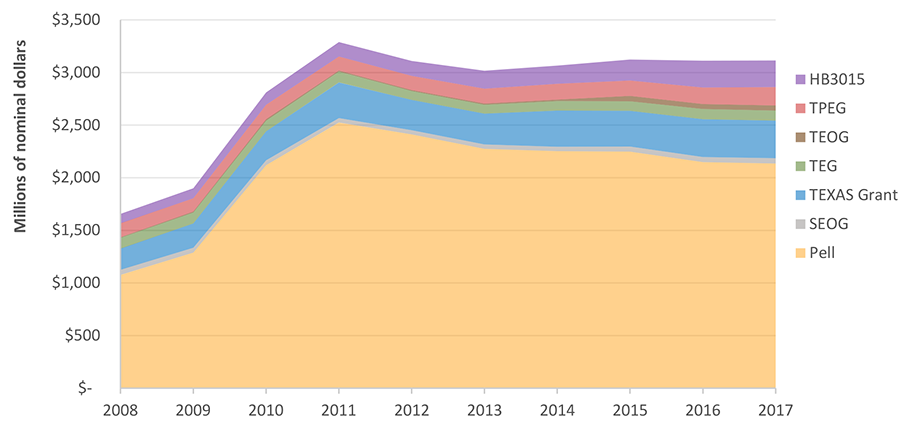
*Amounts for state aid programs are reported by fiscal year, whereas Pell and SEOG are reported by award year (see Glossary)
While the federal Pell Grant Program remains by far the largest source of grant aid in Texas, the total amount disbursed to Texas students has decreased steadily over the past six years. In the 2016–2017 award year (AY), about 585,000 undergraduate students received approximately $2.13 billion in Pell grants. This was a decrease of about $390 million, or 15 percent, from AY 2010-2011, largely due to there being significantly fewer recipients (see page 35).
Overall, state grant aid has increased somewhat over the past six years, though it declined significantly from FY 2011 to FY 2012. The Towards EXcellence, Access, and Success (TEXAS) Grant is the largest of the state grant programs, disbursing over $357 million in FY 2016-2017. TEXAS Grants are available to students who meet a variety of financial and academic criteria, with priority consideration given to students who meet additional academic criteria and a priority filing deadline. As of Fall 2014, initial TEXAS Grants are awarded exclusively to baccalaureate students, although students in other academic programs may be eligible if they received the grant previously.
In FY 2016-2017, the Texas Educational Opportunity Grant (TEOG) – which serves financially needy students at public two-year colleges – saw a slight increase in total disbursements over the prior year. The Tuition Equalization Grant (TEG), which is available to financially needy students at private, non-profit institutions, remained fairly stable in AY 2016-2017 compared to the previous year. The Texas Public Educational Opportunity Grant (TPEG), which public colleges and universities award to financially needy students out of tuition set asides, increased by $17.5 million (11%).
Aid issued under HB 3015, which requires institutions to “set aside” at least 15 percent of all tuition charges exceeding $46 per semester credit hour (SCH) for financial aid to needy resident students, grew considerably between FY 2014-2015 and FY 2016-2017. About 108,000 resident undergraduate and graduate students received about $252 million in HB 3015 aid in FY 2016-2017, up from 72,000 receiving $165 million in FY 2014-2015. Growth in HB 3015 aid accounted for the majority of the overall growth in Texas grant aid from FY 2014-2015 to FY 2016-2017, which helped mitigate the declines in Pell.
Sources: Pell and SEOG: U.S. Department of Education, Federal Student Aid Data Center (http://studentaid.ed.gov/data-center); TX programs: Texas Higher Education Coordinating Board (THECB) Report on Student Financial Aid for Texas Higher Education [Fiscal Years 2006 to 2017] (http://www.thecb.state.tx.us/reports); THECB Financial Aid Database for Fiscal Year 2017 (special request, unpublished tables); College for All Texans (http://www.collegeforalltexans.com)
Average Grant Award in Texas by Major Grant Program, by Fiscal Year (in Current Dollars)
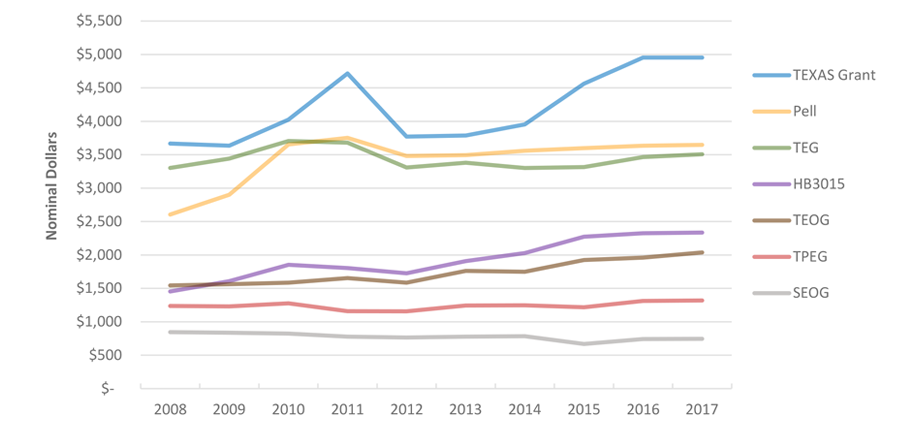
*Amounts for state aid programs are reported by fiscal year, whereas Pell and SEOG are reported by award year (see Glossary)
The largest average grant award in Texas in fiscal year (FY) 2016-2017 (referenced as 2017 in the chart) was for the Towards EXcellence, Access, and Success (TEXAS) Grant at $4,953, equal to the prior year. TEXAS Grants are available to students who meet a variety of financial and academic criteria, with priority consideration given to students who meet additional academic criteria and a priority filing deadline. As of Fall 2014, initial TEXAS Grants are awarded exclusively to baccalaureate students, although students in other academic programs may be eligible if they received the grant previously.
In AY 2016-2017 the average Pell grant in Texas increased by less than one percent, from $3,636 to $3,646, from the prior year, and fewer students received the grant. In AY 2016-2017, about 585,000 Texas postsecondary students received Pell grants, down about 5,000 (1 percent) from about 590,000 the prior year. The maximum Pell grant for AY 2015-2016 was $5,775 and increased to $5,920 for AY 2017-2018. This $145 increase over the last two years is based on the Student Aid and Fiscal Responsibility Act (SAFRA), which provides for automatic changes to the maximum Pell grant based on changes in the Consumer Price Index (CPI), a common measure of inflation.
Average HB 3015 grants and Texas Educational Opportunity Grants (TEOG) have increased over the past ten years, while average Texas Public Educational Opportunity Grants (TPEG) and Supplemental Educational Opportunity Grants (SEOG) have remained basically flat.
Sources: Pell and SEOG: U.S. Department of Education, Federal Student Aid Data Center (http://studentaid.ed.gov/data-center); TX programs: Texas Higher Education Coordinating Board (THECB) Report on Student Financial Aid for Texas Higher Education [Fiscal Years 2006 to 2017] (http://www.thecb.state.tx.us/reports); THECB Financial Aid Database for Fiscal Year 2017 (special request, unpublished tables); College for All Texans (http://www.collegeforalltexans.com); Maximum Pell: U.S. Department of Education, Federal Student Aid (https://studentaid.ed.gov/sa/types/grants-scholarships/pell).
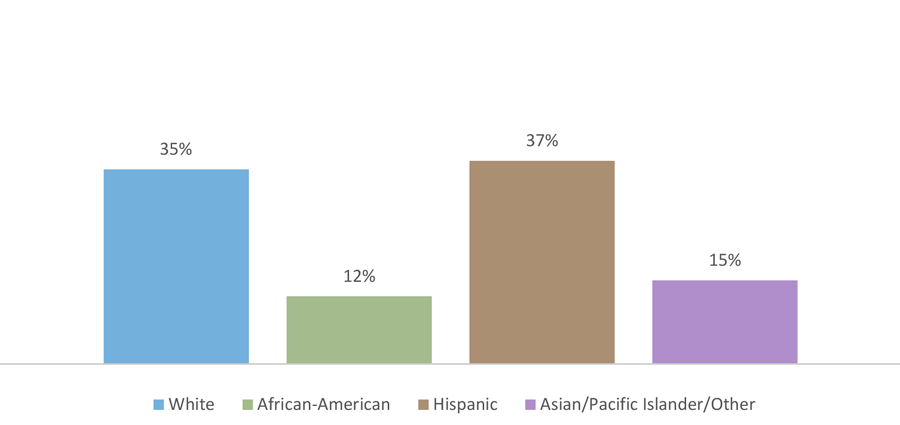
Fall 2017 Enrollment in Texas Higher Education, by Ethnicity
About 72 percent of Texas Educational Opportunity Grant (TEOG) and 70 percent of Toward EXcellence, Access, and Success (TEXAS) Grant recipients are either Hispanic or African-American. The Texas Public Educational Grant (TPEG) and Tuition Equalization Grant (TEG) serve somewhat fewer Hispanic and African-American students — 59 percent and 51 percent, respectively. The percentage of TPEG and TEG recipients who are Hispanic or African-American students has risen slowly over time, likely reflecting the steadily rising proportion of these students enrolled at public and private four-year colleges and universities.
Fiscal Year 2016-2017 Grant Program Recipients by Ethnicity
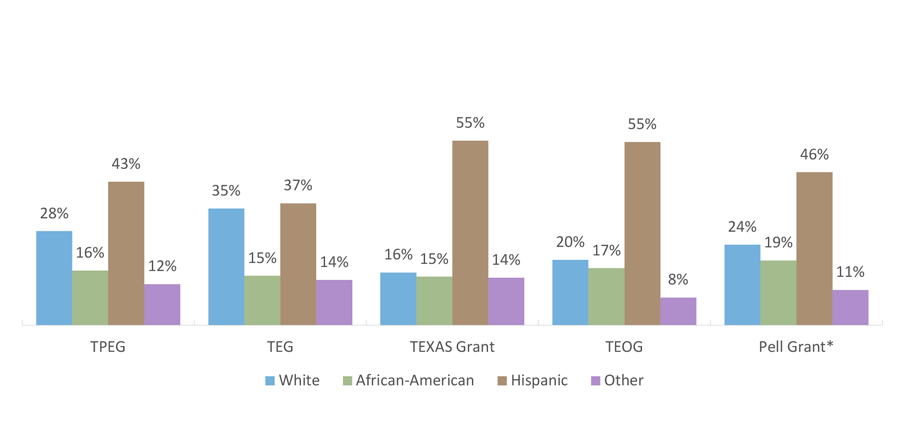
*Pell grant data did not disaggregate “Asian/Pacific Islander” from “Other”, so both are included in “Other”.
Sources: Enrollment by ethnicity: U.S. Dept of Education, National Center for Education Statistics, IPEDS (https://nces.ed.gov/ipeds/); Texas grant programs: THECB Financial Aid Database for Fiscal Year 2017 (special request, unpublished tables).
Total Cost of Attendance for Two Semesters Full-time Attendance at Texas Public Institutions Covered by Average Pell Grant Amount, by Sector (AY 2017-2018)
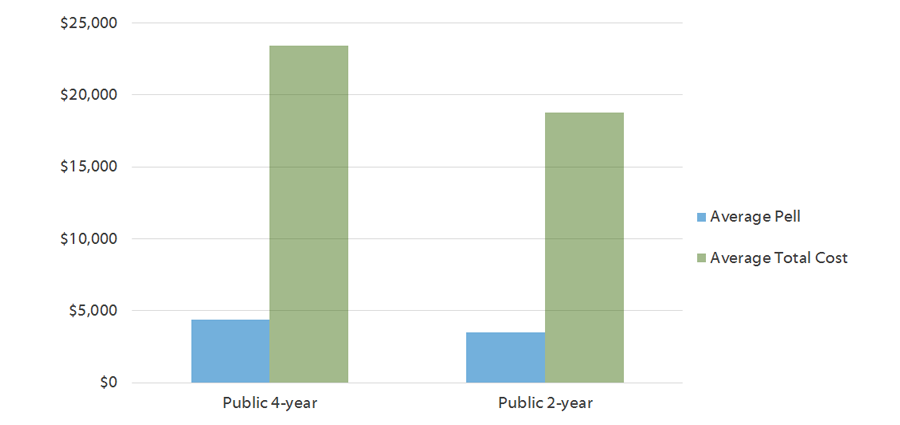
The buying power of the federal Pell Grant, the largest grant program in the U.S. and in Texas, has declined over the last three decades. Designed to be the foundation of need-based grant aid, only undergraduates with significant financial need receive the Pell grant; however, in Award Year (AY) 2017–2018, the average Pell grant in Texas covered only 19 percent of the average cost of attendance (COA; tuition, fees, room, board, and other basic expenses) for eligible undergraduates at public four-year universities in Texas, and the same percentage of the average COA at public two-year colleges in Texas. While the average Pell grant tends to increase from one year to the next, these increases generally fail to keep pace with increases in the cost of college.
The maximum Pell grant for AY 2015–2016 was $5,775 and increased to $5,920 for AY 2017-2018. This $145 increase over the last two years is based on the Student Aid and Fiscal Responsibility Act (SAFRA), which provides for automatic changes to the maximum Pell grant based on changes in the Consumer Price Index (CPI), a common measure of inflation. Pell grant awards are determined according to a schedule that takes both COA and expected family contribution (EFC) into account. Pell grants awards increase for higher COAs and lower EFCs and decrease for lower COAs and higher EFCs. There is also a set maximum EFC beyond which a student cannot qualify for a Pell grant regardless of the COA; for AY 2017-2018, the maximum eligible EFC is $5,328.
Sources: Cost of attendance: U.S. Department of Education, National Center for Education Statistics, IPEDS Data Center (Author’s calculation: Total cost of full-time undergraduate attendance weighted by FTE in-state undergraduate enrollment) (http://nces.ed.gov/ipeds/datacenter/); Pell: U.S. Department of Education, Federal Student Aid Data Center, Programmatic Volume Reports (http://studentaid.ed.gov/about/data-center/student/title-iv); Maximum Pell: U.S. Department of Education, Federal Student Aid (https://studentaid.ed.gov/sa/types/grants-scholarships/pell).
Total State Grant Aid (millions of current dollars)
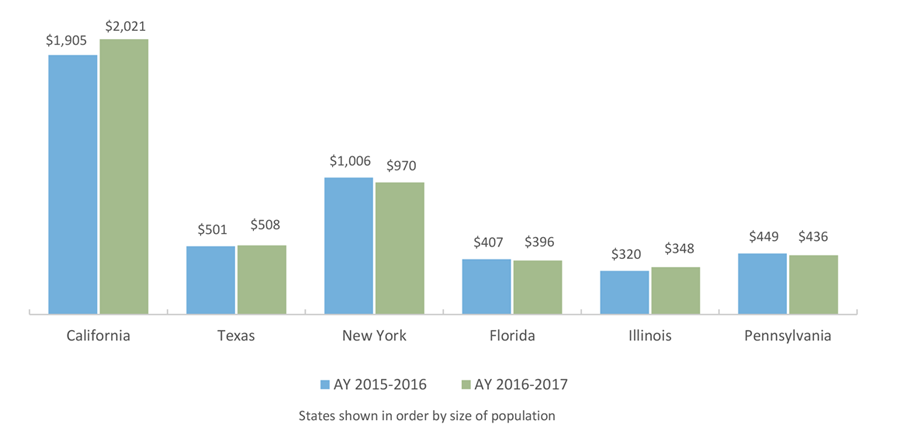
In Award Year (AY) 1996–1997, Texas spent only $48 million in state grant aid, the lowest among the six most populous states despite having the second largest population of postsecondary students. State grant aid began to increase significantly with the establishment of the Toward EXcellence Access, and Success (TEXAS) Grant Program in 1999. In AY 2016–2017, Texas spent about $508 million on grant aid for postsecondary students, just over a quarter of what was spent by California and just over half of what was spent by New York.
State grant aid may be based on financial need, academic merit, a combination of need and merit, or other factors, like veteran status. In Texas, all grant aid is either primarily need-based or has a need-based component. This includes aid that is funded not from legislative appropriations but from institutional revenues, such as the Texas Public Educational Grant (TPEG). This type of aid is often viewed as a form of “tuition discounting”, in which higher prices paid by more affluent students allow students with more financial need to pay less. TPEG, Student Deposit Scholarships, and other such tuition set-aside programs are not included in the state grant aid totals shown above. Tuition exemptions and waivers are also not included in the totals above as they are not considered state grant aid.
Although primarily need-based, maintaining the TEXAS Grant also involves academic components. To remain eligible for the grant, the student must maintain a grade point average (GPA) of at least 2.5 on a 4.0 scale, meet Satisfactory Academic Progress (SAP) requirements, and complete at least 24 credit hours per award year.
As funds are generally inadequate to award full grants to all eligible students, initial year TEXAS Grants are awarded on a priority basis. Eligible students receive priority consideration if they meet a priority filing deadline and at least two of four conditions related to high school academic performance.
Source: TEXAS Grant shortfall: THECB, “Recommendations Relating to the Feasibility Study for Restructuring Texas Student Financial Aid Programs, November 2008” (http://www.thecb.state.tx.us/reports/PDF/1671.PDF); All other: National Association of State Student Grant and Aid Programs. 48th Annual Survey Report on State-Sponsored Student Financial Aid. 2017 (https://www.nassgapsurvey.com/survey_reports.aspx).
Median Total U.S. Veterans’ Education Benefits in AY 2015-2016
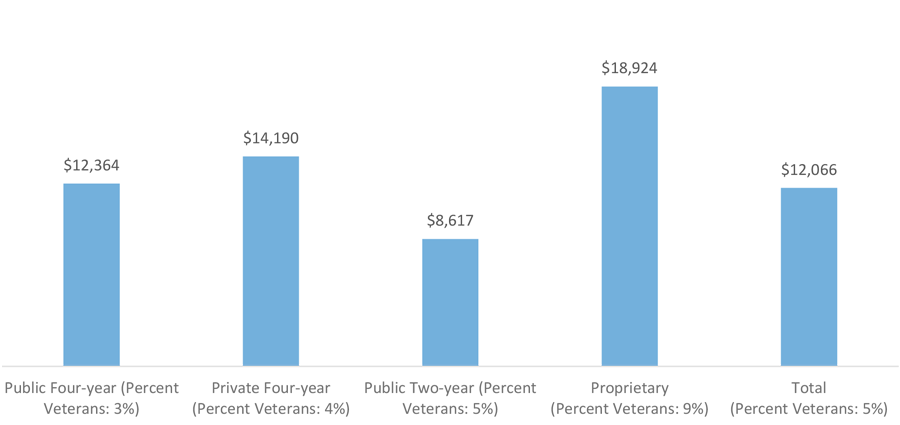
Veterans comprised about 5 percent of all enrolled undergraduates nationwide in academic year 2015-2016 and received a median of $12,066 per person in total federal, state, and institutional veterans’ education benefits* in that year.
The proprietary sector had the highest proportion of veteran undergraduate students, at nine percent, and the highest median amount of benefits received, at $18,924. The median individual amount of total veterans’ education benefits received was lowest at public two-year institutions, at $8,617.
*Institutional benefits include the institutional portion of the Yellow Ribbon program benefits. Federal benefits include Department of Defense military tuition grants and include payments made for tuition and fees, housing, books and supplies, work-study, and other educational expenses (as reported by the Veterans Benefits Administration).
Source: U.S. Department of Education, National Postsecondary Student Aid Study (NPSAS) 2016 (http://www.nces.ed.gov/das).
Average Net Price for Full-time, First-time Undergraduates in Texas by Sector and Income Quintile (AY 2016-2017)
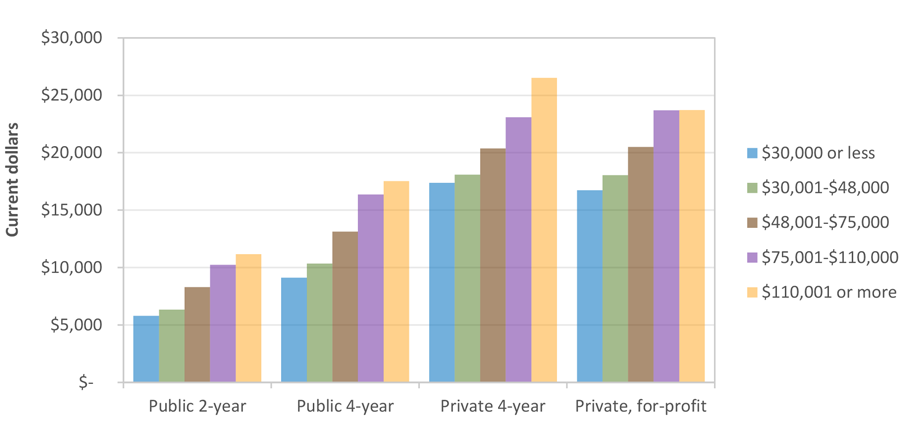
The net price of attendance for a student at an institution of higher education is defined as the student’s cost of attendance* minus the total grants and scholarships he or she receives from any sources: in essence, the amount that a student (and/or family) must pay either out of pocket or with student loans. In Award Year (AY) 2016–2017, the average** net price of attendance for students with the lowest incomes*** was $5,805 (a decrease of four percent from the previous year) in the public two-year sector, $9,124 (an increase of nine percent) in the public four-year sector, $17,374 (a decrease of five percent) in the private four-year sector, and $16,724 (a decrease of 14 percent) in the for-profit sector.
Net price generally rises with income across all four sectors, which likely reflects higher-income students’ tendencies to attend higher-cost institutions and pay a larger percentage of their costs out of pocket. Both of these tendencies are likely more notable in the private four-year sector due to the wider variety of prices in that sector.
* Tuition and fees, books and supplies, food and housing, transportation, and other expenses, for a full-time student for nine months. For public institutions, the net price reflects costs for in-state/in-district students.
**Average net prices for Texas are calculated as the weighted averages of institution-level average net price by income group, where the weight is the number of full-time, first-time degree-seeking undergraduates in the income group at the institution.
*** For dependent students, income represents the student’s family income; for independent students, it represents personal income.