
State of Student Aid in Texas – 2019
HHL-CAL Loan Volume by Award Year (in Millions of Dollars)*
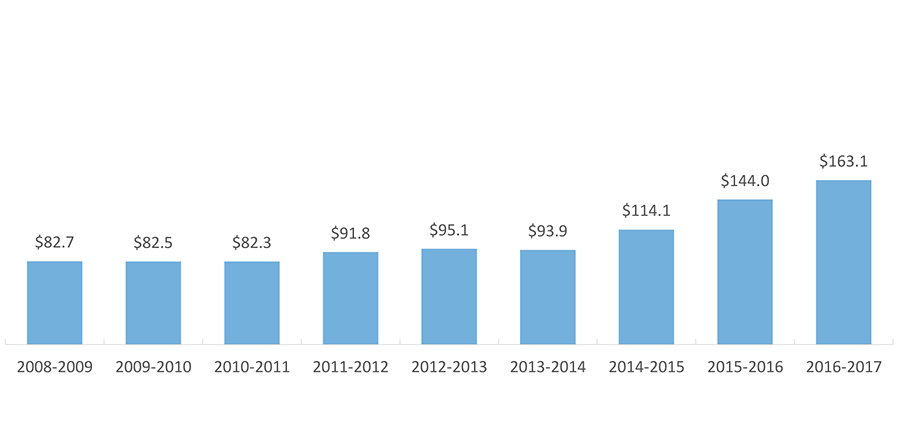
The Hinson-Hazlewood College Access Loan (HHL-CAL) is the largest of the loan programs that the State of Texas offers for students. Recipients are not required to demonstrate financial need to receive HHL-CAL loans. A student may borrow up to the cost of attendance at his or her institution, minus any other financial aid he or she is receiving. In AY 2016-2017 HHL-CAL awards totaled $163.1 million, a 13 percent increase over the previous year. This marks the third year of increases in award totals for this loan program.
HHL-CAL Volume and Enrollment by Region
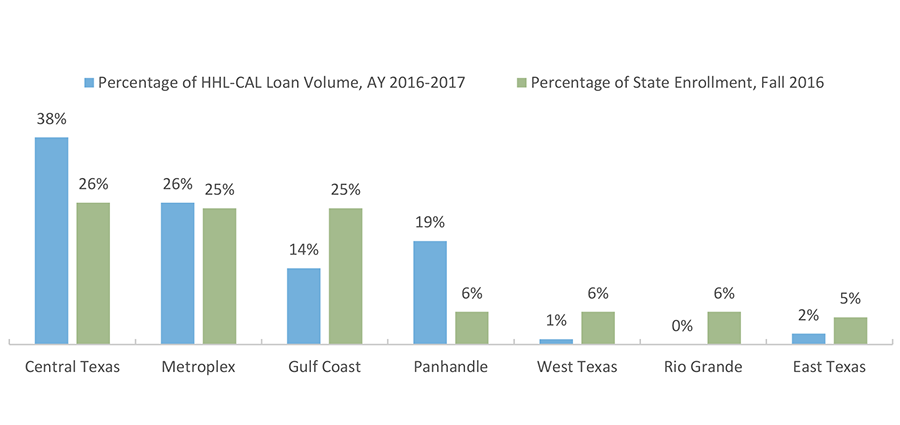
In AY 2016–2017, 38 percent of the HHL-CAL dollars went to students attending schools in the Central Texas region. Although Central Texas comprises only 26 percent of Texas enrollment, it is home to the state’s two flagship universities, the University of Texas at Austin and Texas A&M University. The Metroplex region received approximately the same percentage of HHL-CAL dollars as it represented in student enrollment. All other regions, except for the Panhandle region, received a smaller percentage than their share of the state’s enrollment.
* Includes only the amounts reported in the Texas Higher Education Coordinating Board’s Financial Aid Database. The Financial Aid Database primarily records aid that was based on financial need, but may include some amounts that were not based on need.
Sources: Loan volume: Texas Higher Education Coordinating Board (THECB), “Financial Aid Database for AY 2016–2017,” Austin, Texas, 2018 (Unpublished tables); Data on loan terms and loan eligibility: THECB, “College for Texans” Website (http://www.collegeforalltexans.com/apps/financialaid/tofa.cfm?Kind=L); Enrollment: THECB. Texas Higher Education Data (http://www.txhighereddata.org/).
HHL-CAL Volume and Student Enrollment by Sector
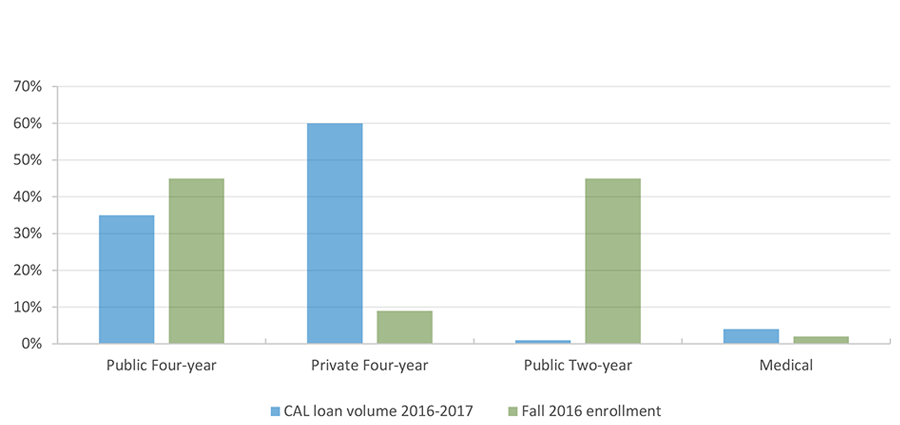
The majority of students in Texas attend public colleges and universities. The proportion of Hinson-Hazlewood-College Access Loan (HHL-CAL) volume by school type does not parallel student enrollment.* In Award Year (AY) 1996–1997, 28 percent of HHL-CAL loan volume went to students in public universities and 68 percent went to students in private universities, where costs typically are higher. The gap between the percentages narrowed throughout the 1990s. By AY 2002–2003, the percentage of HHL-CAL loan volume going to students in public institutions was greater than that going to students attending private institutions. About 51 percent of all HHL-CAL volume in AY 2007–2008 went to students in public four-year universities and 45 percent went to students in private four-year universities.
However, this trend has reversed in recent years. In AY 2016– 2017, 35 percent of HHL-CAL dollars went to students attending public four-year institutions, and this sector accounted for 45 percent of student enrollment. Private four-year students accounted for 9 percent of enrollment in Texas postsecondary institutions, but 60 percent of HHL-CAL volume. Similarly, public two-year students accounted for 45 percent of enrollment, but only 1 percent of HHL-CAL volume. This pattern is at least partially because the cost of attendance at public two-year schools is generally lower than at four-year schools.
* HHL-CAL volume data for students who attended for-profit institutions are not available.
Sources: Loan volume: Texas Higher Education Coordinating Board (THECB). “Financial Aid Database, 2016-2017,” Austin, Texas, 2018 (Unpublished tables); Public Enrollment: THECB. “PREP Online” (http://www.txhighereddata.org/Interactive/PREP_New).
HHL-CAL Volume and Enrollment*
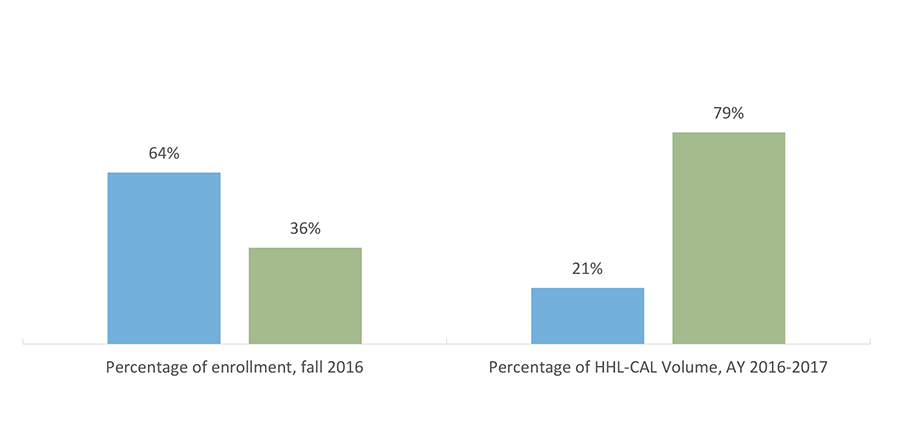
Texas has nine Historically Black Colleges and Universities (HBCUs) and 99 Hispanic-Serving Institutions (HSIs). In Award Year (AY) 2005–2006, HBCUs and HSIs comprised 33 percent of total Texas enrollment and received 14 percent of Hinson-Hazlewood College Access Loan (HHL-CAL) dollars. In AY 2016–2017, HBCUs and HSIs comprised 64 percent of total Texas enrollment and received 21 percent of HHL-CAL dollars. This gap has widened compared to last year as the enrollment at HBCUs and HSIs makes up a larger portion of the overall higher education enrollment.
Average HHL-CAL Award by Ethnicity (AY 2016-2017)
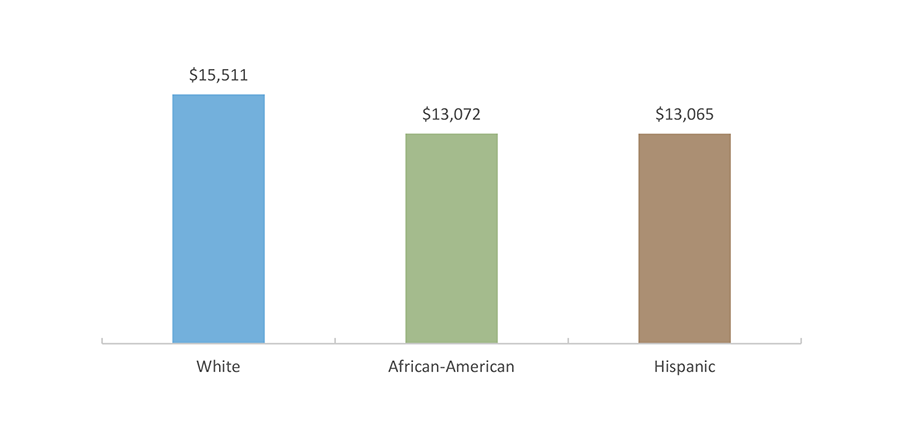
The average HHL-CAL award differed across ethnic groups in AY 2016–2017. White students on average borrowed about $2,439 more than African-American students and $2,446 more than Hispanic students.
* Includes only the amounts reported in the Texas Higher Education Coordinating Board’s Financial Aid Database. The Financial Aid Database primarily records aid that was based on financial need, but may include some amounts that were not based on need.
Sources: Loan volume: Texas Higher Education Coordinating Board (THECB). “Financial Aid Database for AY 2016–2017.” Austin, Texas, 2018 (Unpublished tables); Enrollment: THECB. Texas Higher Education Data (http://www.txhighereddata.org/). HBCUs: U.S. Department of Education, Office for Civil Rights database. “Accredited Postsecondary Minority Institutions” (http://www.ed.gov/about/offices/list/ocr/edlite-minorityinst.html); HSIs: U.S. Department of Education, unpublished report (special request).
Top Schools by Region (AY 2017–2018)
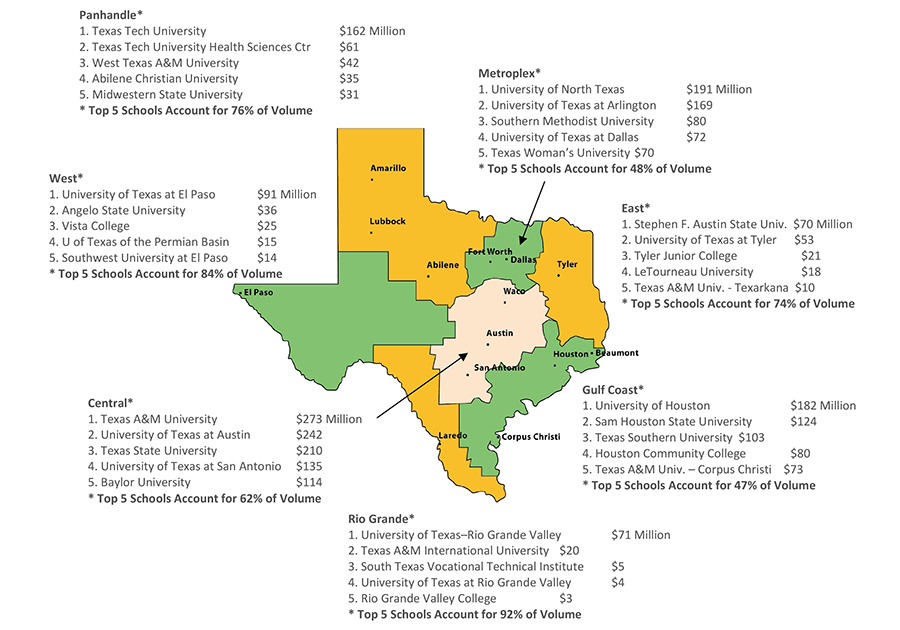
In the rural areas of the state, Award Year (AY) 2017–2018 Federal Direct Loan Program (FDLP) volume remains concentrated among a few schools. In regions that contain the state’s largest cities, loan volume is more widely distributed. For example, in the Rio Grande region, five schools account for 92 percent of regional loan volume, while in the Gulf Coast region the five schools with the largest loan volume account for less than half of regional volume. This is most likely due to the greater number of school choices that exist in the more urbanized regions of the state.
Sources: U.S. Department of Education, Federal Student Aid Data Center, Programmatic Volume Reports (https://studentaid.ed.gov/sa/about/data-center/student/title-iv).
Federal Loan Volume by Region and School Type
In Millions of Nominal Dollars (AY 2017–2018)
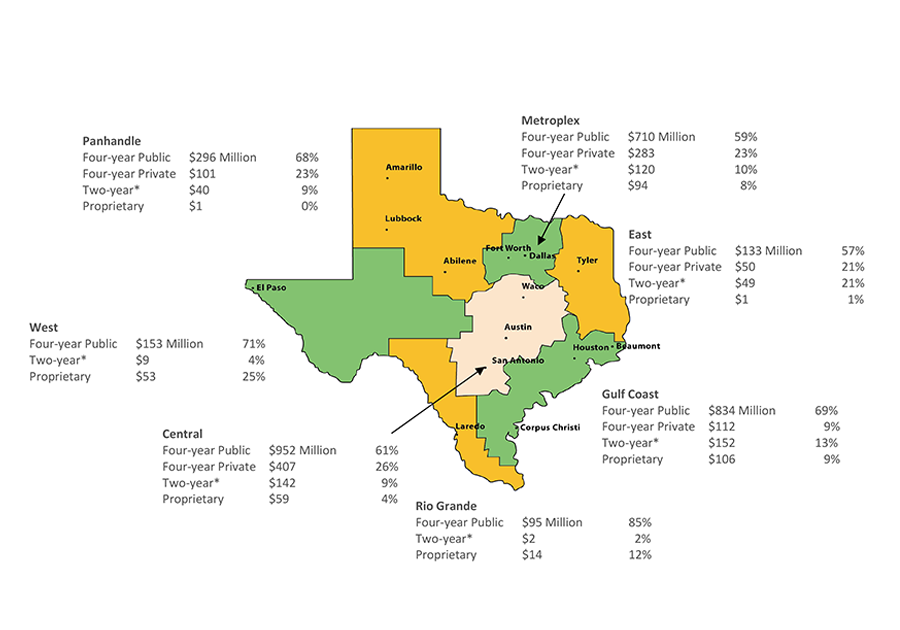
Four-year public school volume makes up the largest share of the volume in all regions. Proprietary school volume exceeds two-year* school volume in two regions. In Award Year (AY) 2017–2018, public four-year schools accounted for 64 percent of the state’s Federal Direct Loan Program (FDLP) volume. Four-year private school volume accounted for 19 percent, two-year* school volume accounted for 10 percent, and proprietary school volume accounted for 7 percent of total FDLP volume in Texas.
Texas Federal Loan Volume by School Type AY 2017–2018
| School Type | Amount (in Millions) | % of Amount |
|---|---|---|
| Public Four-year | $3,173 | 64% |
| Private Four-year | $954 | 19% |
| Two-year* | $514 | 10% |
| Proprietary | $328 | 7% |
*The two-year category includes both public and private, not-for-profit, and excludes proprietary.
Source: : U.S. Department of Education, Federal Student Aid Data Center, Programmatic Volume Reports (https://studentaid.ed.gov/sa/about/data-center/student/title-ivl).
Ratio of HBCU/HSI Federal Loan Volume to HBCU/HSI Enrollment*
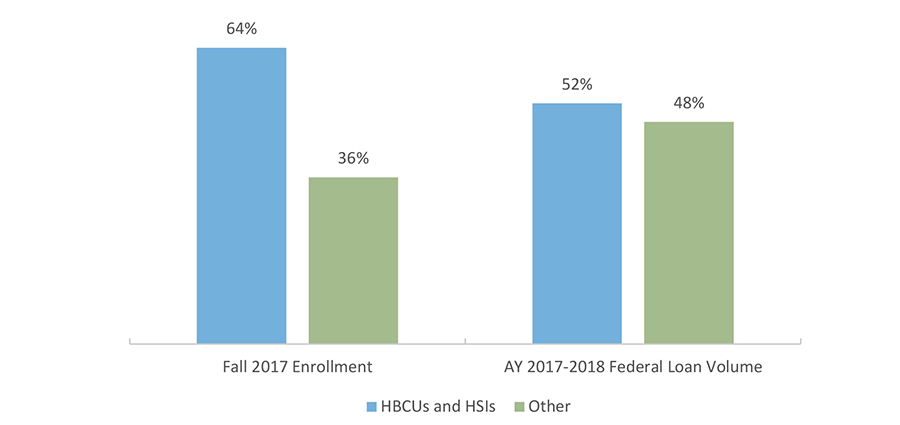
Texas has nine Historically Black Colleges and Universities (HBCUs) and 99 Hispanic Serving Institutions (HSIs). HBCUs and HSIs accounted for 64 percent of total Texas enrollment in fall 2017 while generating 52 percent of Award Year 2017–2018 Federal Direct Loan Program (FDLP) volume.
HBCUs are higher education institutions that were established prior to 1964 with the intention of primarily serving the African-American community, though students of all races and ethnicities are welcome to apply. There are 107 HBCUs nationwide.
Institutions meeting certain eligibility criteria, such as having at least a 25 percent Hispanic undergraduate enrollment, can apply for federal funding under Title III of the Higher Education Act. This federal program helps HSIs better serve their populations, which often include first generation and low-income students.
*Does not include proprietary schools for volume or enrollment.
Sources: Enrollment: U.S. Department of Education, National Center for Education Statistics, Integrated Postsecondary Education Data System (IPEDS) 2018 (http://nces.ed.gov/ipeds/); Loan Volume: U.S. Department of Education, Federal Student Aid Data Center, Programmatic Volume Reports (https://studentaid.ed.gov/sa/about/data-center/student/title-iv); HBCUs: U.S. Department of Education, Office for Civil Rights database. “Accredited Postsecondary Minority Institutions” (http://www.ed.gov/about/offices/list/ocr/edlite-minorityinst.html); HSIs: U.S. Department of Education, unpublished report (special request).
Percent With and Without Student Loans by Veteran Status, In AY 2015-2016
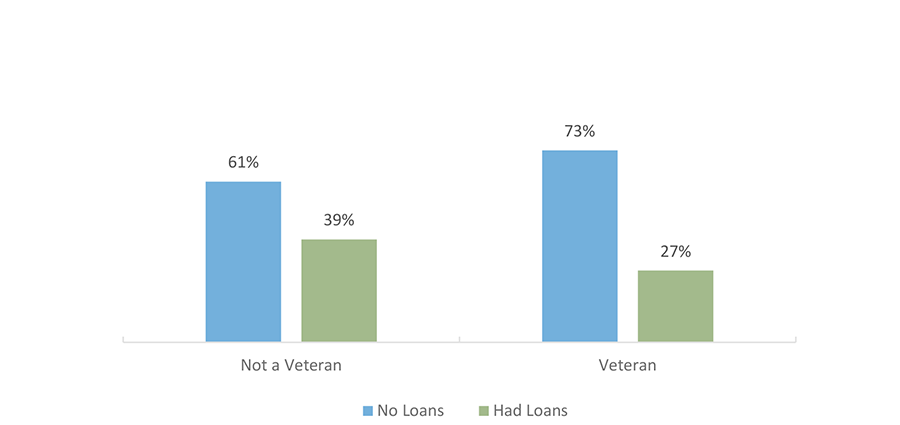
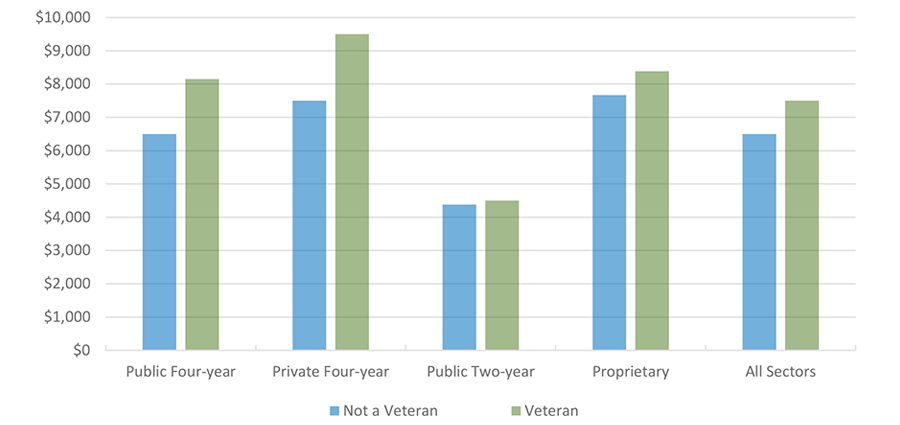
Although they were less likely to be borrowers, veteran undergraduates borrowed larger amounts than non-veterans when they did borrow. The difference between veterans and non-veterans was particularly pronounced in the four-year sectors.
Median Student Loan Amount by Sector and Veteran Status, In AY 2015-2016
Sources: U.S. Department of Education, National Postsecondary Student Aid Study (NPSAS) 2016 (http://www.nces.ed.gov/das).
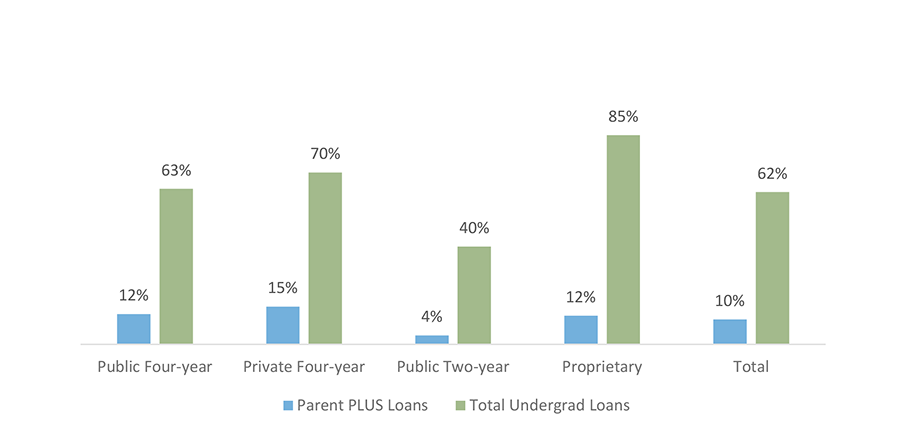
Percentage of 2015-2016 Graduates Who Borrowed for Undergraduate Education, by Loan Type and Sector
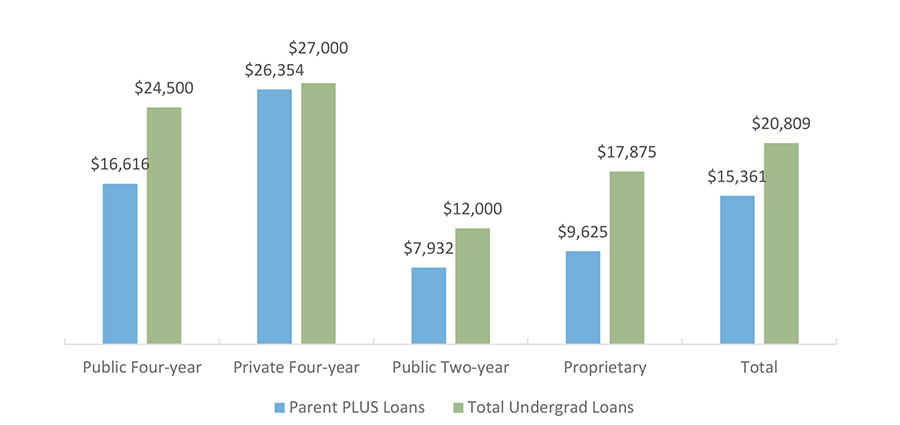
Cumulative Loans Borrowed by 2015-2016 Graduates, by Loan Type and Sector
Almost two-thirds of undergraduates nationwide who graduated in academic year (AY) 2015-2016 had borrowed student loans, and 10 percent had parents who had borrowed parent PLUS loans. The public two-year sector had the lowest borrowing rates, with 40 percent of students borrowing and 4 percent of students’ parents borrowing. The private four-year sector had the highest parent borrowing rate, at 15 percent, and the proprietary sector had the highest student borrowing rate, at 85 percent.
While parent borrowing rates were much lower than student borrowing rates, the average cumulative amounts borrowed were often not much lower. In the private four-year sector, parents ended up borrowing nearly as much as the students, with both groups having the highest median amounts among all the sectors. Overall, undergraduates who graduated in 2015-2016 ended up borrowing almost $21,000 and the parents ended up borrowing more than $15,000.
Sources: U.S. Department of Education, National Postsecondary Student Aid Study (NPSAS) 2016 (http://www.nces.ed.gov/das).
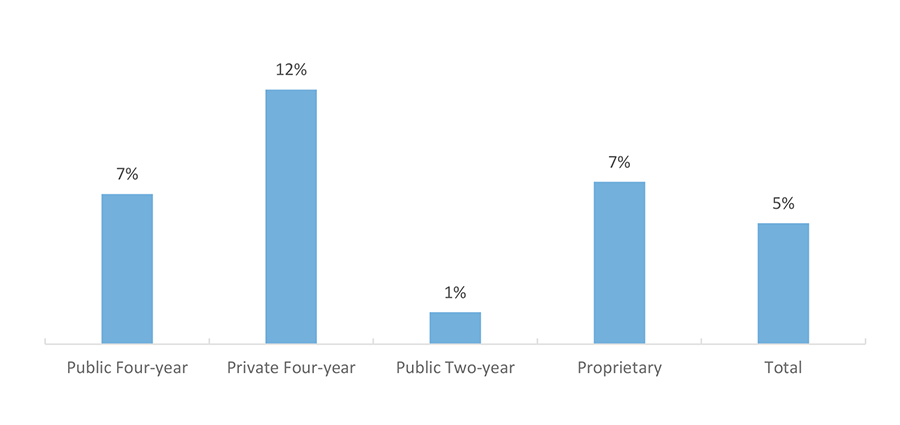
Percentage of Students Who Borrowed Private Loans in AY 2015-2016, by Sector
Median Private Loan Amount for Students Who Borrowed in AY 2015-2016, by Sector
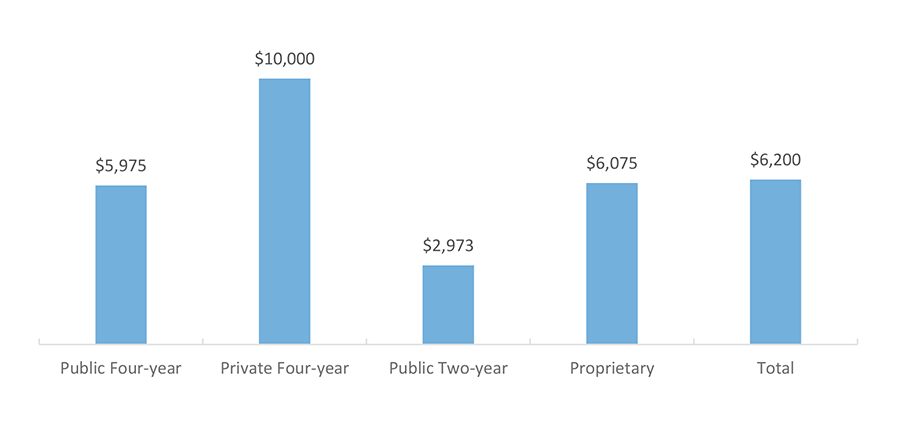
About five percent of undergraduates in academic year (AY) 2015-2016 borrowed a private education loan. The amount borrowed varied by school sector, ranging from a median of $2,973 at public two-year institutions to a median of $10,000 at private four-year institutions. The overall median was $6,200.
Sources: U.S. Department of Education, National Postsecondary Student Aid Study (NPSAS) 2016 (http://www.nces.ed.gov/das).
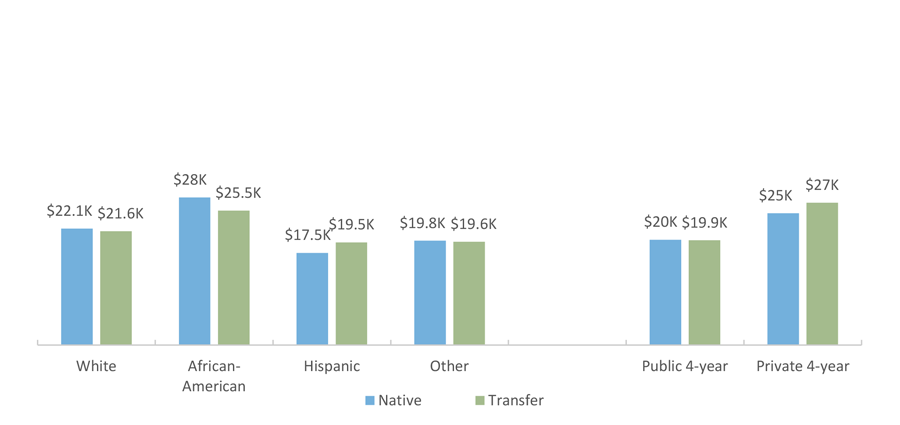
U.S. Low-income AY 2007-2008 Bachelor’s Recipients’ Median Cumulative Loan Debt through AY 2007-2008, by Race/Ethnicity and Sector
Percentage of U.S. Low-income AY 2007-2008 Bachelor’s Recipients Who Borrowed Any Student Loan, by Race/Ethnicity and Sector
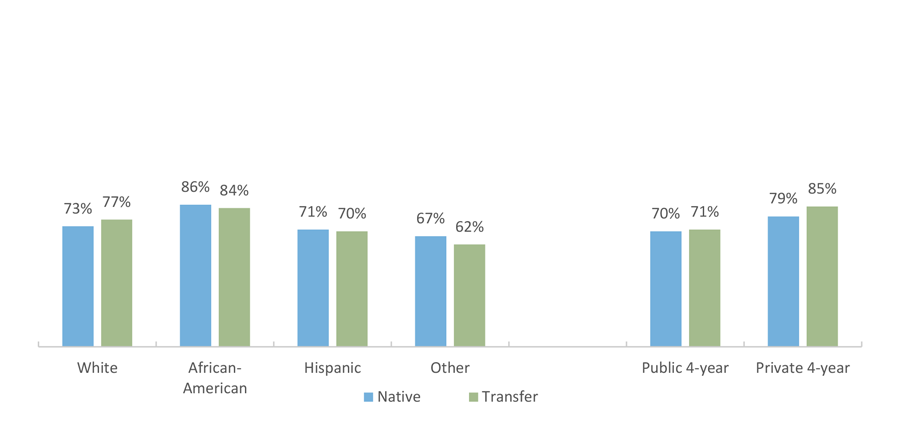
Low- and middle-income bachelor’s degree recipients borrowed about the same student loan amounts regardless of whether they started at a two-year college or a four-year university. Most transfer students were not able to avoid borrowing by starting at a community college and generally borrowed more than “native” students during their final years of college. Transfer students also tended to recieve less grant and institutional aid than native students, especially at four-year private universities, which likely increased their need to borrow at their four-year institutions.
Many factors contribute to higher borrowing among transfer students. Transfer students tend to receive less grant aid, but they also tend to enroll at schools that provide less grant aid to all students, to have lower incomes and lower SAT scores, and to take significantly longer to finish their degrees. Prospective transfer students face many challenges. According to a 2009 study by the National Center for Education Statistics, only about one third of community college students who intend to transfer to a university actually end up doing so within three years, and several studies have reported better academic outcomes for students of four-year universities versus community colleges. High school students should consider these trends as well as their individual goals and circumstances in making their postsecondary enrollment decisions.