
State of Student Aid in Texas – 2019
SAT Average Scores for 2018 High School Graduates
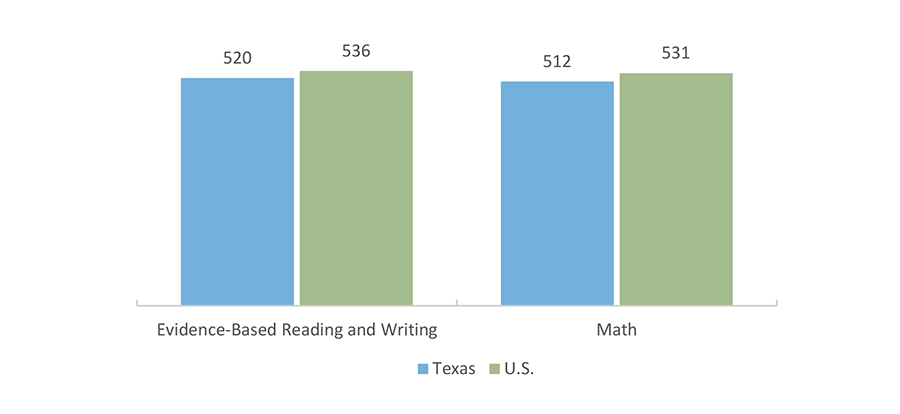
More than 200,000 Texas high school seniors and 2.1 million high school seniors nationwide — well over half the total graduating class for both groups — took the SAT in the 2017–2018 school year. Average SAT scores are lower in Texas compared to the U.S. in both categories.
ACT Average Scores (2018)
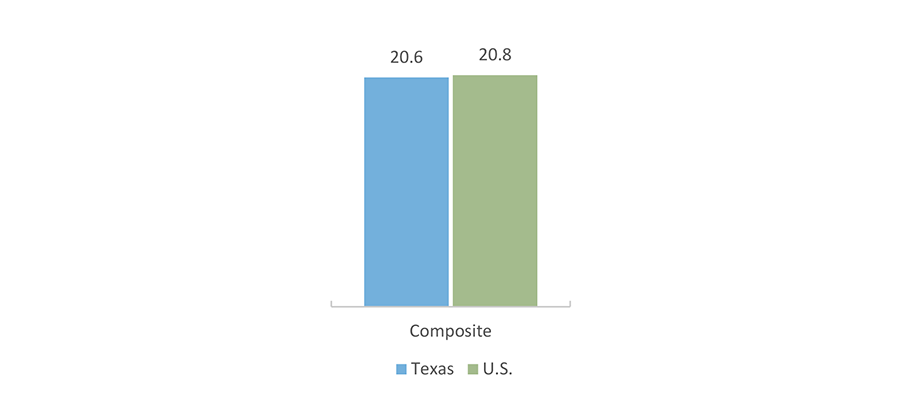
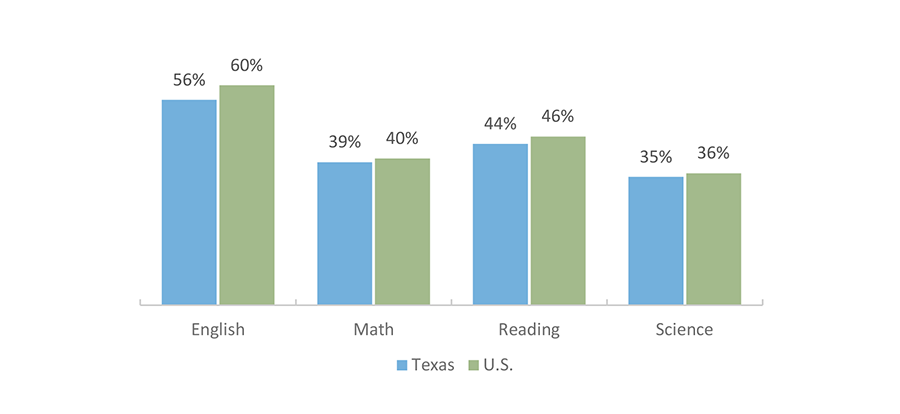
The American College Test (ACT) is less popular in Texas than the SAT but may be gaining in popularity. Forty-one percent of the class of 2018 Texas high school graduates took the ACT, up from 37 percent since 2013. Nationally, 55 percent of high school graduates took the exam. While average ACT composite scores in Texas have often lagged slightly behind national averages, the average composite score for Texas graduates has roughly mirrored that of the nation as a whole in recent few years, with slight variations in each subject area.
Source: SAT: The College Board, SAT Data & Reports, College-Bound Seniors 2018 (https://reports.collegeboard.org/pdf/2018-total-group-sat-suite-assessments-annual-report.pdf; https://reports.collegeboard.org/pdf/2018-texas-sat-suite-assessments-annual-report.pdf); ACT: ACT, National and State Scores 2018 (https://www.act.org/content/act/en/research/condition-of-college-and-career-readiness-2018.html).
PSAT/NMSQT Test Takers Who Are on Track to be College Ready (2017-2018)
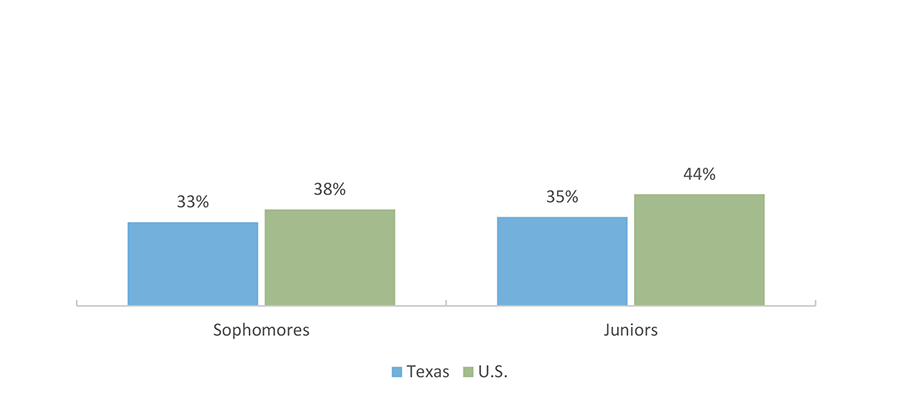
The Preliminary SAT (PSAT) and National Merit Scholar Qualifying Test (NMSQT) are taken by high school sophomores and juniors. The tests help the students prepare for the SAT and prompt them to begin planning for college. The College Board has developed college readiness benchmark scores that students should meet or exceed in order to be considered on track for college readiness. Based on this measure, Texas sophomores and juniors lag behind their national peers somewhat in college readiness.
Percentage of AP Test Takers who Scored at Least a 3 on at Least One AP Test (2000 – 2017)
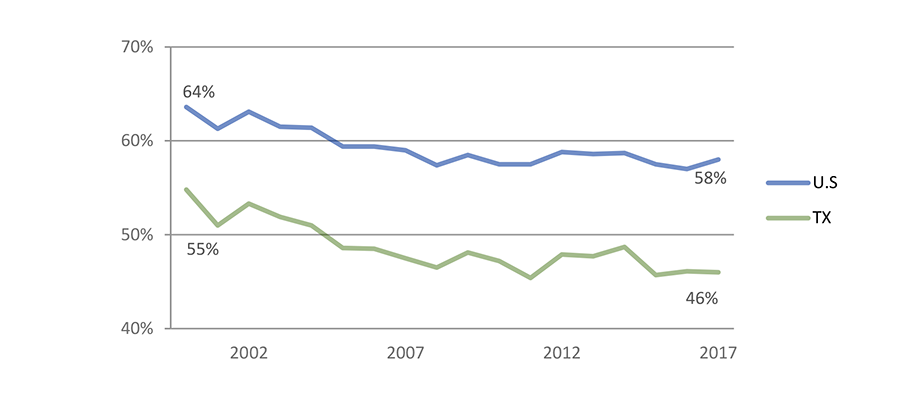
The Advanced Placement (AP) program offers more than 30 college-level courses and examinations to high school students, though a student can take an exam without having taken the course. These courses satisfy high school diploma requirements, and sufficient scores on the exams can help students gain admission to selective colleges and even earn college credit (at the institution’s discretion). Since 2005, all public higher education institutions in Texas that have freshman level courses have been required to grant credit to incoming students who earn a 3 or higher on an AP exam.
Texas trailed the nation in success rates in 2017, with 46 percent of test takers earning at least a 3 on an AP exam compared to 58 percent nationally. The percentage of AP test takers who scored at least a 3 on at least one AP test has declined both nationally and in Texas since 2000, however, the total numbers of AP test takers have also increased significantly during this time period.
Source: PSAT/NMSQT: The College Board, PSAT/NMSQT Data & Reports (https://reports.collegeboard.org/pdf/2018-texas-sat-suite-assessments-annual-report.pdf; https://reports.collegeboard.org/pdf/2018-total-group-sat-suite-assessments-annual-report.pdf); AP: The College Board, AP Program and Participation Data 2017 (https://research.collegeboard.org/programs/ap/data/archived/ap-2017).
Percentage of 2016-17 Texas High School Graduates Enrolled in Texas Higher Education in Fall 2017
Percentage of 2016-17 Texas High School Graduates Who Enrolled in Texas Higher Education in Fall 2017, by School Type
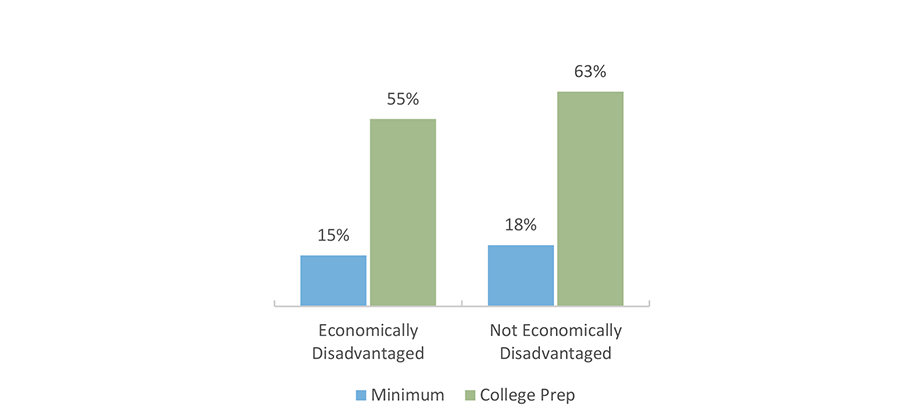
While family income has a positive association with college enrollment, access to a high school curriculum of high academic intensity and quality, such as the Recommended or Distinguished achievement programs in Texas, can also play a key role in students’ success. A U.S. Department of Education study found that the intensity and quality of a student’s high school curriculum has a bigger impact on bachelor’s degree completion than either the student’s high school test scores or the student’s grade point average (GPA).
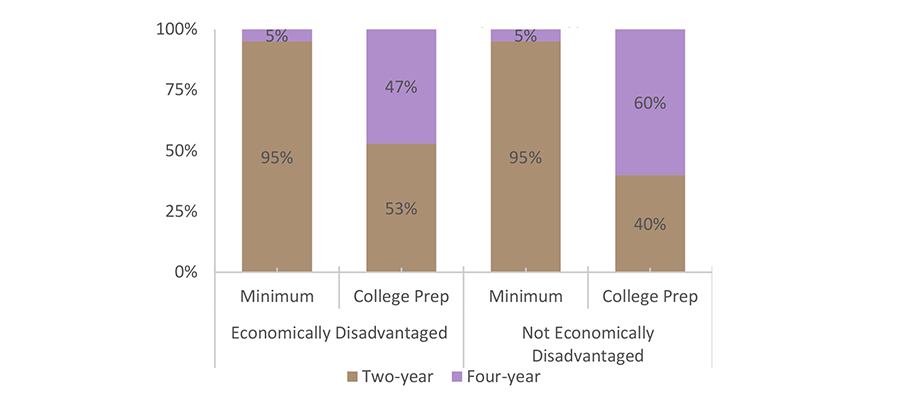
In 2016–17, high school graduates with College Prep* diplomas were more likely to enroll in college immediately following graduation, with 55 percent of economically disadvantaged** students with College Prep diplomas enrolling in college compared to 15 percent of those with minimum diplomas. For students who were not economically disadvantaged, 63 percent of those with College Prep diplomas enrolled in college compared to 18 percent of those with minimum diplomas. “Economically disadvantaged,” college-prepared high school graduates are 13 percentage points less likely than college-prepared students considered “not economically disadvantaged” to enroll in a four-year college after graduation.
*A high school student who graduates under either the Recommended or Distinguished achievement program is considered to have a College Prep diploma for the purposes of this analysis, and a graduate of the Minimum achievement program is considered a Minimum program. The Recommended and Distinguished programs require more completed credits (26) in mathematics, science, social studies, language other than English, and fine arts than the minimum program. The Minimum program has fewer required completed credits (22). Students enrolled under the Foundation program, fourteen percent of 2016-17 Texas high school graduates, are excluded from this analysis as this new diploma program is intended to replace all existing diploma types, and thus encompasses minimum and college prep curriculums.
** The Texas Education Agency (TEA) collects data on whether a student is “economically disadvantaged” based on the student’s eligibility for free or reduced lunch as a proxy for family income. The TEA does not have detailed information about family income.
Sources: High school curriculum and degree completion: U.S. Department of Education, Office of Educational Research and Improvement, Answers in the Tool Box: Academic Intensity, Attendance Patterns, and Bachelor’s Degree Attainment, by Clifford Adelman (1999)
(http://www2.ed.gov/pubs/Toolbox/toolbox.html); Side-by-Side Comparison: Texas Graduation Programs 2014-2015: (https://tcta.org/sites/tcta.org/files/current_hb5_grad_requirements_comparison_chart.pdf); All other: THECB, “2016-2017 Texas High School Graduates Enrolled in Higher Education Fall 2017, by Economic Category, Diploma Type, and Ethnicity” (unpublished tables).
High School Graduation Rates (2015-2016)
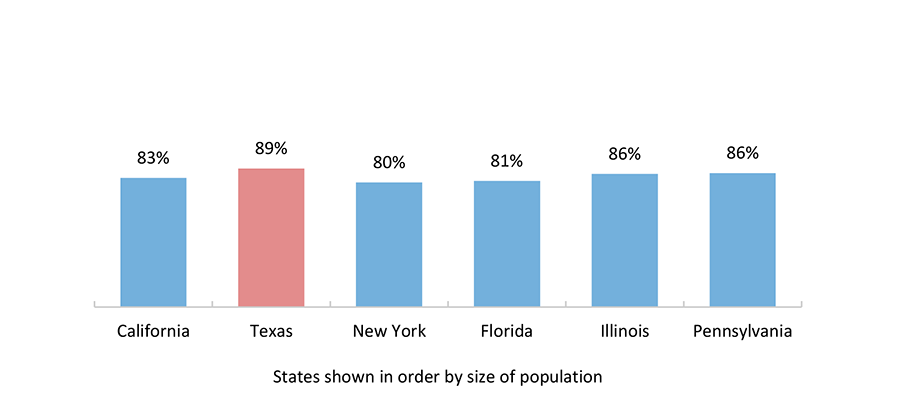
Texas ranked fifth in the nation for high school graduation rates in 2015-2016, tying with 4 other states at 89 percent. Texas ranked highest among the six most populous states in the nation and led the most populous states in graduation rates within racial and ethnic groups. Nationally, the overall graduation rate in 2015-2016 was 84 percent.
High School Graduation Rates, by Race/Ethnicity (2015-2016)
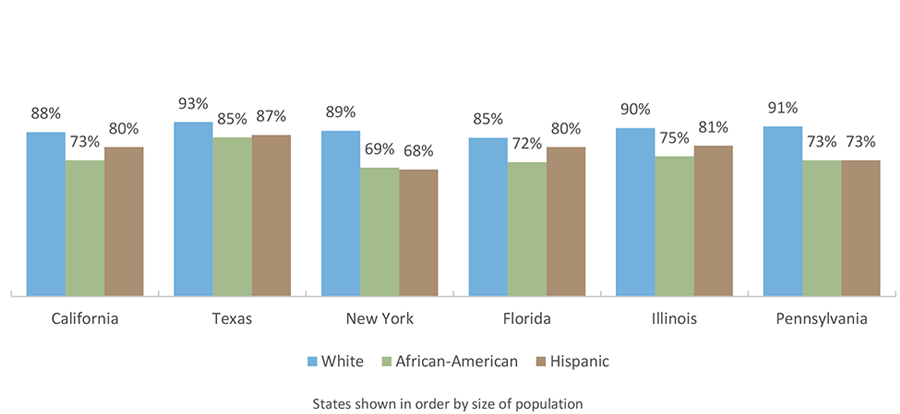
The recent increases in high school graduation rates have been due in part to dramatic reductions in the number of “dropout factory” high schools in the past 10 years. These schools are defined as having 60 percent or less of their ninth-grade class still enrolled in their senior year. In 2002, more than 2.6 million students were enrolled in these type “dropout factory” high schools compared to less than 900,000 in 2015.
Sources: Graduation Rates: U.S. Department of Education, ED Data Express, Data about elementary and secondary schools in the U.S. (https://eddataexpress.ed.gov/); All else: America’s Promise Alliance, 2017 Building a Grad Nation Report: Progress and Challenge in Raising High School Graduation Rates (http://gradnation.americaspromise.org/report/2017-building-grad-nation-report#driver-5-low-graduation-rate-high-schools).
People Age 25 and Older Who Have Not Finished High School (2016)
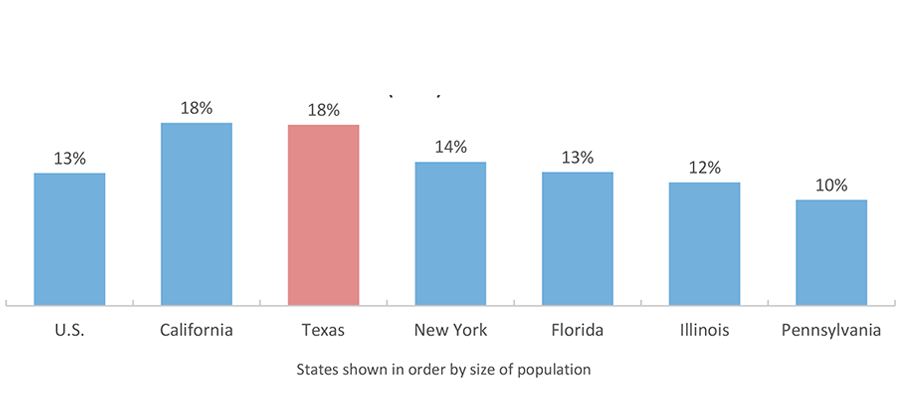
In 2016, 18 percent of people age 25 and older (or 3 million people) in Texas had not finished high school. This is the same percentage as California and a higher percentage than any other state in the nation. In the U.S., 13 percent of adults had not finished high school. Not completing high school can have a detrimental effect on college access. However, overall high school diploma attainment in Texas is improving. Recent Texas high school graduation rates rank Texas near the top compared to other states.
People Age 25 and Older Who Have Not Finished High School (2014)
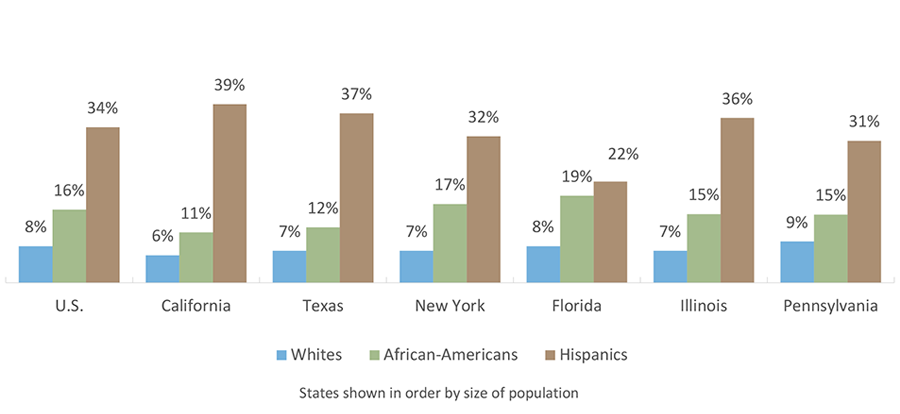
The high school completion rates of different racial and ethnic groups vary widely. Although these disparities exist in many areas of the country, they are particularly important for Texas, which has become a “minority-majority” state. At the high school level, data show that:
- Hispanics, who comprised over a third of the Texas population in 2016 and who are projected to comprise 53 percent by 2050, are the least likely to have obtained a high school diploma. As of 2016, 37 percent of Hispanics age 25 and older had not finished high school.
- Approximately 12 percent of African-Americans in Texas have not completed high school. This represents a major improvement since 2006, when 17 percent of African-Americans had not finished high school.
Sources: Texas State Data Center and Office of the State Demographer, Texas Population Projections Program, “Population Projections for the State of Texas and Counties in One File,” 2014 (http://www.txsdc.utsa.edu/Data/TPEPP/Projections/Index.aspx).
High school completion among 25 and older: U.S. Census Bureau, 2015 American Community Survey 1-Year Estimates, Detailed Tables (http://www.census.gov/acs/www/); High school graduation rates: U.S. Department of Education, ED Data Express, Data about elementary and secondary schools in the U.S. (http://eddataexpress.ed.gov/).
Percentage of Texas High School Graduates Enrolling in College Immediately after Graduation*
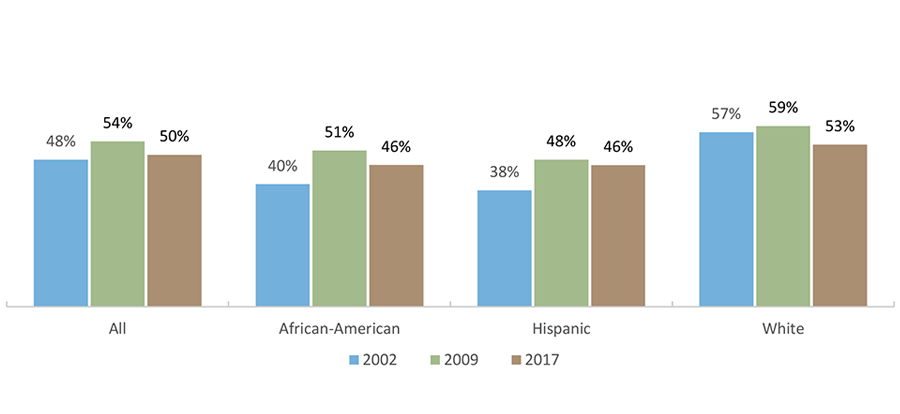
In 2000, Texas set the goal of “Closing the Gaps” in participation and success in higher education by 2015 by increasing the number of students enrolled and the number of degrees awarded. The new 15-year plan, 60x30TX, began in 2015, building on the goals and results of the “Closing the Gaps” plan.
In 2002, 48 percent of all Texas high school graduates entered college in the summer or fall immediately after high school graduation. This increased to 54 percent in 2009, but has been steadily declining slightly each year since to 50 percent in 2017. This overall trend holds for the individual racial/ethnic groups – the rates reach a high point in 2009 and then fall slightly each year after until 2017.
The percentage of White students who enroll still exceeds the percentage of non-Whites; however, this gap is closing. There was a 19-percentage point gap between White students and Hispanic students in 2002 which shrank to 7 percentage points by 2017, due both to rising college enrollment rates among Hispanic students and dropping rates among White students. A similar trend is seen comparing African-American students to White students. Keeping track of college enrollment immediately following high school graduation is important because delaying postsecondary enrollment after high school graduation is a risk factor for eventually dropping out of college or never enrolling.
* Includes only Texas high school graduates who enrolled in a Texas public or private, nonprofit college or university. Data on students who enrolled at proprietary institutions or enrolled in out-of-state schools are not available. In AY 2007–2008, about 93 percent of Texas students who enrolled in college immediately after high school graduation were attending school in their state of residence.
Sources: “Closing the Gaps” goals: Texas Higher Education Coordinating Board (THECB) Closing the Gaps. October 2000 (http://www.thecb.state.tx.us/reports/PDF/0379.PDF?CFID=11742258&CFTOKEN=38987795 ); Texas high school students enrolling in college immediately after graduation: Texas Higher Education Coordinating Board (THECB) High School to College Linkages, 2017, “High School Graduates Enrolled in Higher Education the Following Fall: State Summary by Ethnicity and Higher Education Sector, Fall 2000 to Fall 2017” (http://www.txhighereddata.org/index.cfm?objectId=2783AAA6-ADCB-E35A-5BFC8F501DC1D65A).
Percentage of 2016-17 Texas High School Graduates Enrolled in Texas Higher Education in Fall 2017, by Ethnicity
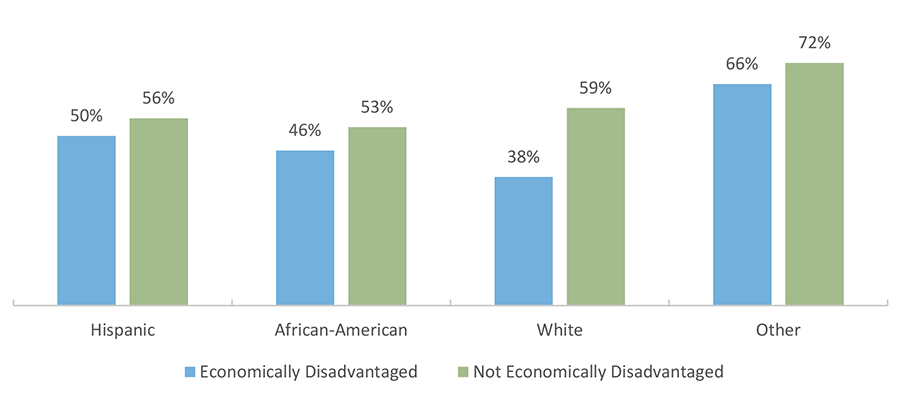
Economically disadvantaged* high school graduates in Texas are less likely to enroll in college. This is true across all racial and ethnic categories but is especially pronounced for White students.
Number of 2016-17 Texas High School Graduates, by Ethnicity

Only 17 percent of White high school graduates in Texas are considered to be economically disadvantaged, while 64 percent of Hispanic and 57 percent of African-American high school graduates are considered economically disadvantaged.
*The Texas Education Agency (TEA) collects data on whether a student is “economically disadvantaged” based on the student’s eligibility for free or reduced lunch as a proxy for family income. The TEA does not have detailed information about family income.
Sources: The Texas Higher Education Coordinating Board, “2015-2016 High School Graduates Enrolled in Higher Education Fall 2016, by Diploma Type and Ethnicity” (unpublished tables).
Fall 2018 FAFSA Completion Rate by Region*
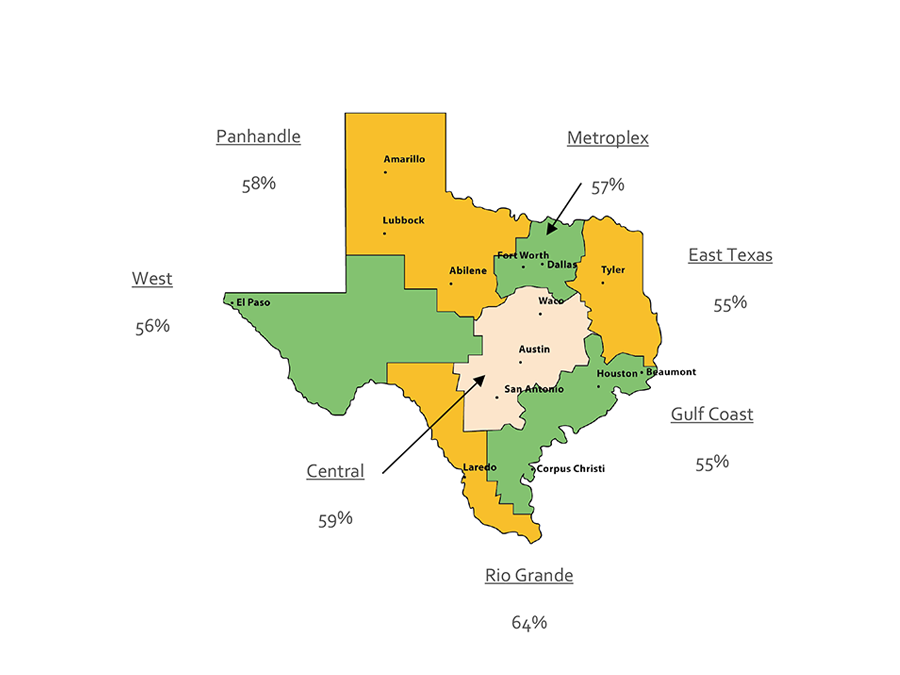
The Free Application for Federal Student Aid (FAFSA) is the standardized financial aid application used by nearly all colleges and universities to award all types of financial aid. The form is administered by the U.S. Department of Education. Many students and families do not realize that most colleges and universities use this form to award all financial aid, not only Federal loans and grants. By completing the FAFSA, students and their families may have access to more financial options and may be able to make more informed decisions about college enrollment.
The statewide FAFSA completion rate was 57 percent in fall 2018 and varied from 55 percent in the East Texas and Gulf Coast regions to 64 percent in the Rio Grande Valley region. The overall state FAFSA rate fell 5 percentage points from the previous year, potentially in part due to dramatically increased rates of verification requests in the 2017-18 FAFSA cycle. FAFSA verification is the term used when the U.S. Department of Education requests additional information or action from students who have submitted applications in order to verify the accuracy of the information. Students who submit applications that are incomplete or have conflicting information are more likely to be flagged for verification, but students may also be selected at random. The time delays and additional effort associated with getting through the verification process may cause some students to miss out on aid, or may discourage students from completing the application or enrolling at all.
* Fall 2018 represents the class of 2017-2018 high school seniors completing the FAFSA as of September 28, 2018.
Source: U.S. Department of Education, Office of Federal Student Aid, FAFSA Completion by High School (http://studentaid.ed.gov/about/data-center/student/application-volume/fafsa-completion-high-school). Number of high school seniors from Texas Education Agency (special request); FAFSA Verification Issues: The Daily Texan, Increased FAFSA Verification Requests Cause Students Trouble (December 7, 2017) (http://www.dailytexanonline.com/2017/12/07/increased-fafsa-verification-requests-cause-students-trouble).
Percent of 2016-17 Texas High School Graduates, Enrolled in Texas Higher Education in Fall 2017 that Met All TSI Standards
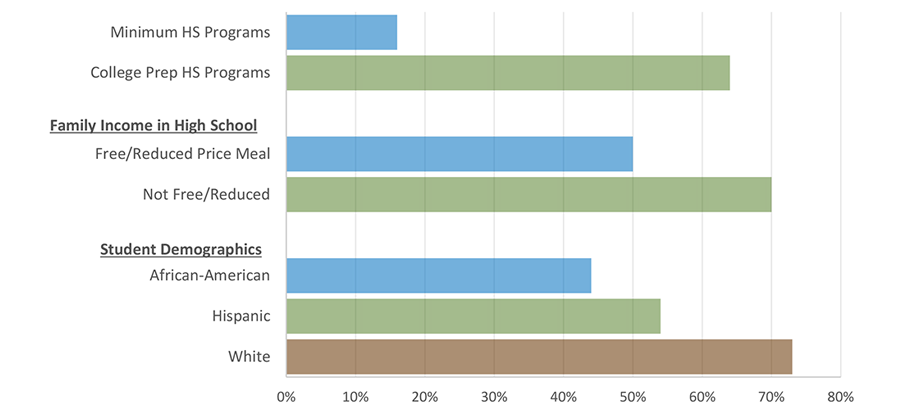
The Texas Success Initiative (TSI) was created by the state to help colleges and universities assess the college-readiness of incoming students in reading, writing, and math. To meet TSI standards, students either score high enough on an approved TSI assessment or complete an approved TSI exemption (e.g., scoring above a threshold on the SAT, ACT, or TAKS tests, or completing college-level coursework). Students who do not meet TSI standards may be required to complete developmental coursework – courses that often do not count towards a certificate or degree program – before enrolling in college-credit courses.
Of all 2016-17 high school graduates who enrolled in higher education the following fall, 61 percent met TSI standards in math, writing, and reading. However, the percentages of high school students who met all TSI standards varied widely when comparing characteristics. Students who enrolled in higher education after completing the minimum high school diploma program were far less likely to meet TSI standards than students who completed the College Prep* diploma. Sixty-four percent of students in the College Prep diploma program met all TSI standards, compared to just 16 percent of those completing the minimum diploma program.
Low-income high school graduates were also less prepared for college than their peers. Fifty percent of students who received free or reduced-price meals in high schools – a common metric to identify low-income students – met all TSI standards compared to 70 percent of students who did not receive free or reduced-price meals. College readiness measures also varied based on student demographics. Seventy-three percent of White students met all TSI standards, compared to 54 percent of Hispanic students and 44 percent of African-American students.
*A high school student who graduates under either the Recommended or Distinguished achievement program is considered to have a College Prep diploma for the purposes of this analysis, and a graduate of the Foundation or Minimum achievement program is considered a Minimum program. The Recommended and Distinguished programs require more completed credits (26) in mathematics, science, social studies, language other than English, and fine arts than the minimum program. The Minimum program has fewer required completed credits (22).