
State of Student Aid in Texas – 2020
Texas, National Three-year Cohort Default Rates*
(FY 2010–2016)
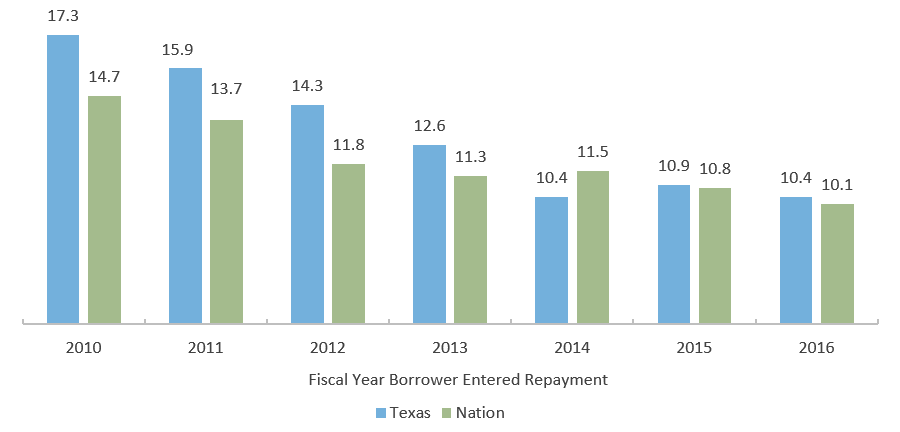
Federal cohort default rates (CDRs) have gradually declined during the last seven years for both Texas and the nation. During this period of improvement, the difference between Texas and national CDRs have narrowed to where the two are now nearly equivalent.
This decline in CDRs is likely due to general economic improvement (particularly the falling unemployment rate) and increased usage of flexible repayment options like income-driven repayment plans. The federal government and many institutions have made new efforts to inform borrowers of these repayment plans, which cap monthly payments at a percentage of income and require no payments at all below a certain income threshold. Improvements in student success indicators likely also contributed to lower CDRs. How the COVID-19 pandemic will affect CDRs will depend on these same indicators, as well as the nature of government relief for student borrowers.
*A three-year cohort default rate is the percentage of student borrowers with loans entering repayment in a given fiscal year who default on their obligations during that given fiscal year or in the next two fiscal years that follow. The FY 2016 cohort default rate, for example, is based on student borrowers who entered repayment during FY 2016 and subsequently defaulted by the end of FY 2018.
Sources: U.S. Department of Education, Fiscal Year Three-Year Official Cohort Default Rates, Washington, D.C., 2019.
Three-year Cohort Default Rates*
(FY 2015 – 2016)
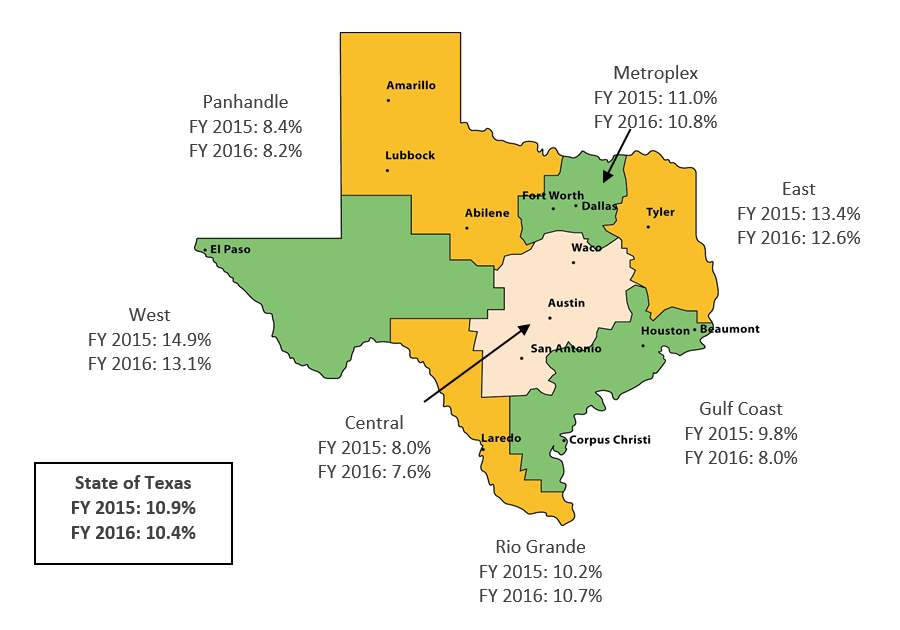
The overall Fiscal Year (FY) 2016 three-year cohort default rate (CDR) for Texas was 10.4 percent (compared to 10.9 percent in FY 2015). Texas’ FY 2016 CDR was 0.3 percentage points higher than the 10.1 default rate for the nation.
Cohort default rates for FY 2016 vary substantially from region to region, from a high of 13.1 percent in the West Texas region to a low of 7.6 percent in the Central Texas region. All of the Texas regions experienced a decrease in the three-year default rates between FY 2015 and FY 2016 except for the Rio Grande region. The largest differences were seen for schools in the West and Gulf Coast regions, where the three-year CDR dropped 1.8 percentage points between FY 2015 and FY 2016.
*A three-year cohort default rate is the percentage of student borrowers with loans entering repayment in a given fiscal year who default on their obligations during that given fiscal year or in the next two fiscal years that follow. For example, the FY 2016 cohort default rate is based on student borrowers who entered repayment during FY 2016 and subsequently defaulted by the end of FY 2018.
Sources: U.S. Department of Education, Fiscal Year 2014 and Fiscal Year 2015 Three-Year Official Cohort Default Rates, Washington, D.C., 2019.
Texas Three-year Cohort Default Rates* by School Type
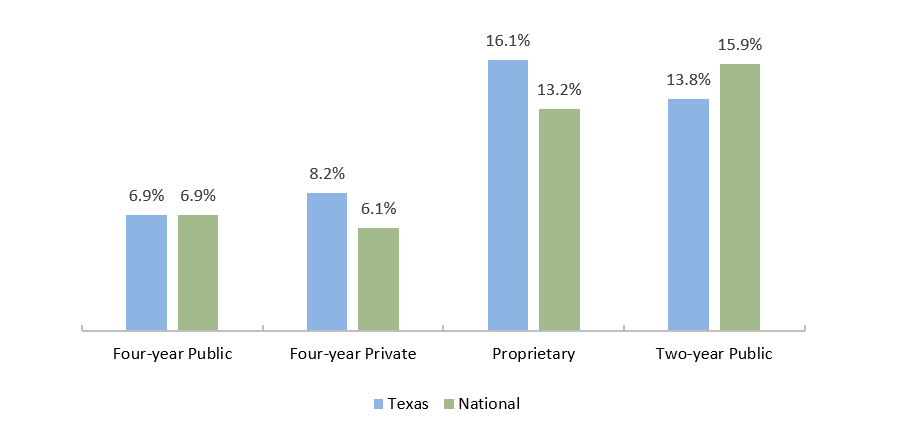
Texas borrowers who attended short-term programs have a combined FY 2016 three-year cohort default rate (CDR) more than twice the rate of those who attended four-year schools (14.4 percent and 7.1 percent, respectively). Although some proprietary schools offer bachelor’s degrees or higher, most proprietary schools in Texas offer short-term programs exclusively. At 16.1 percent, the highest FY 2016 three-year CDR is for the proprietary sector, followed by the two-year sector with a 13.8 percent CDR. This is a significant reversal compared to the nation as a whole, where the proprietary sector had a slightly lower CDR than the public two-year sector. Most sectors in Texas had a decrease in their rate from FY 2015 to FY 2016.
There are several factors that contribute to the tendency toward higher CDRs for short-term programs, as compared to four-year schools. For example, borrowers from short-term programs are more likely to have risk factors for dropping out of school, such as attending school part time, working full time, and having a low family income than are students from four-year colleges and universities. Also, post-college earnings tend to be lower for graduates of short-term programs compared with graduates of four-year schools.
*A three-year cohort default rate is the percentage of student borrowers with loans entering repayment in a given fiscal year who default on their obligations during that given fiscal year or in the next two fiscal years that follow. The FY 2016 cohort default rate, for example, is based on student borrowers who entered repayment during FY 2016 and subsequently defaulted by the end of FY 2018.
Sources: Cohort Default Rates: U.S. Department of Education, Fiscal Year 2016 Official Cohort Default Rates, Washington, D.C., 2019; Proprietary School Program Length: U.S. Department of Education, National Center for Education Statistics, Integrated Postsecondary Education Data System (IPEDS) 2018 (http://nces.ed.gov/ipeds); All Other: U.S. Department of Education, National Center for Education Statistics, “National Postsecondary Student Aid Study (NPSAS) 2016” (http://www.nces.ed.gov/das/).
Percentage of Borrowers Who Defaulted within 12 Years of Starting College, by Degree Type
1995-96 and 2003-04 Cohorts
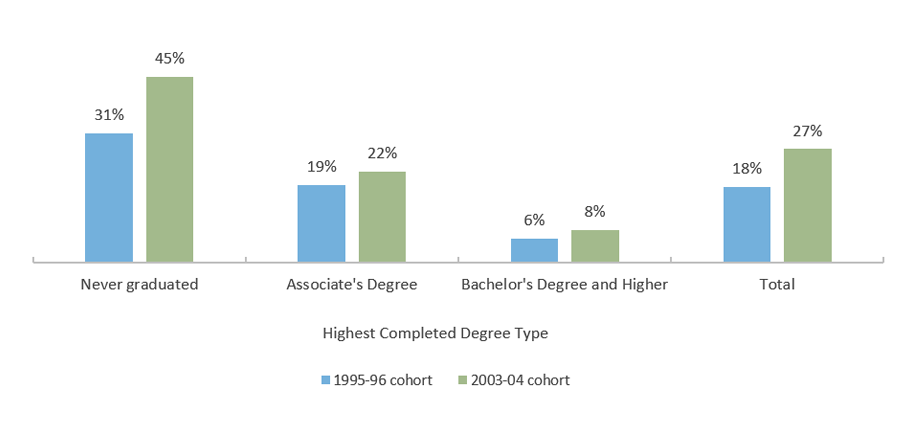
Most who track student loan default rates focus on the official three-year cohort default rate. Yet there is value in better understanding student loan repayment from a more long-term perspective. The National Center for Education Statistics has produced a data base which approximates this broader view of repayment. Approximately 31 percent of all student borrowers who first started their postsecondary education in the 1995-96 academic year and did not graduate had defaulted sometime during the 12 years after first starting college. The default rates for associate’s degree and bachelor’s degree holders were much lower. Just under six percent of borrowers who earned a bachelor’s degree or higher had defaulted on their loans in the 12-year timeframe.
The default rates for borrowers who first started college in the 2003-04 academic year were higher across all categories, particularly among those who never graduated. This is likely due in part to the 2007-08 economic recession that hit many of those borrowers early in their work life following college. Those with less education have higher unemployment rates than those with more, and this was certainly true during and following the recession.
There are several factors that contribute to the tendency toward higher default rates for short-term programs, such as associate’s degrees, as compared to four-year schools. For example, borrowers from short-term programs are more likely to have risk factors for dropping out of school, such as attending school part time and working full time, than are students from four-year colleges and universities. Also, earnings tend to be lower for graduates of short-term programs compared with graduates of four-year schools.
When the timeframe for tracking the 1995-96 cohort was extended from 12 to 20 years, 25.4 percent of all student borrowers had defaulted. The more recent cohort has already exceeded that rate at just the 12-year mark.
Sources: Default Rates: U.S. Department of Education, National Center for Education Statistics, Repayment of Student Loans as of 2015 Among 1995-96 and 2003-04 First-Time Beginning Students, October 2017 (https://nces.ed.gov/pubsearch/pubsinfo.asp?pubid=2018410); Risk Factors: U.S. Department of Education, National Center for Education Statistics, “National Postsecondary Student Aid Study (NPSAS) 2012” (http://www.nces.ed.gov/das/); Unemployment Rates: Bureau of Labor Statistics. “Employment Status of the Civilian Population 25 Years and Over by Educational Attainment,” March 2018 (https://www.bls.gov/news.release/empsit.t04.htm).
Trellis used its extensive portfolio of Federal Family Education Loan Program loans to study students who had borrowed loans (guaranteed by Trellis) at a Texas institution and entered repayment any time between October 1, 2007 and September 30, 2011. An examination of 391,362 borrowers found that:
- Nearly a quarter (24%) of borrowers defaulted within five years of entering repayment, and most of them had previously suspended their payments using deferment or forbearance.
- About one in five borrowers (21%) owed more on their loans after five years in repayment than they did when they started repayment, accruing interest through heavy uses of deferment, forbearance, and delinquency.
- About one in five borrowers (22%) paid their loans during the first five years of repayment without missing or pausing any payments.
| Repayment Group | Percent of Borrowers | Repayment Subgroup | Percent of Borrowers |
|---|---|---|---|
| Defaulters | 24% | Paused Any Payment | 14% |
| Missed Any Payment | 10% | ||
| Balance Increasers | 21% | N/A | N/A |
| Balance Decreasers | 45% | Uninterrupted | 22% |
| Paused Any Payment | 20% | ||
| Missed Any Payment | 3% | ||
| Consolidators | 10% | N/A | N/A |
Sources: The Pew Charitable Trusts, Student Loan System Presents Repayment Challenges, November 2019 (https://www.pewtrusts.org/-/media/assets/2019/11/psbs_report.pdf).
Trellis tracked 391,362 student loan borrowers from its administrative data base of Family Federal Education Loan Program loans through their first five years in repayment to learn about their repayment patterns and outcomes. These students borrowed loans guaranteed by Trellis at a Texas institution and entered repayment at any time between October 1, 2007 and September 30, 2011.
Defaulters who did not pause their payments by using deferments or forbearances experienced difficultly repaying from the start, with the vast majority of these borrowers defaulting in their second year in repayment. Defaulters who paused payments tended to default in their third, fourth, or fifth year of repayment.
Timing of Default by Type of Defaulter
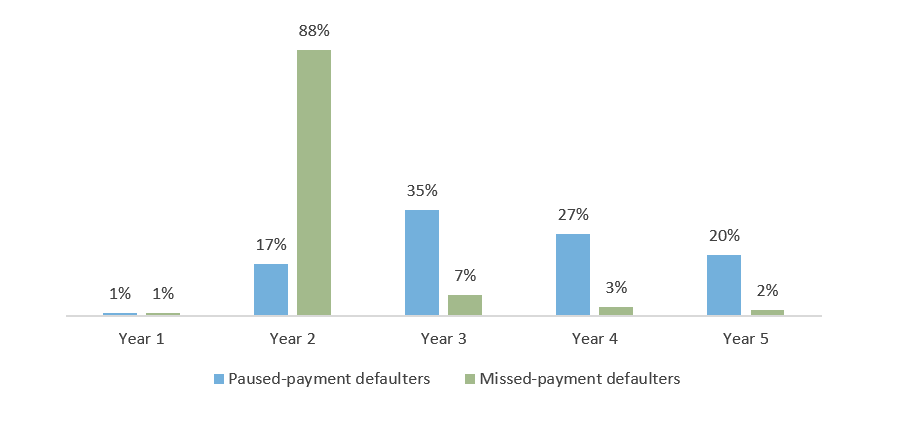
*In Trellis’ administrative database of Family Federal Education Loan Program loans, borrowers are considered to be in default when the servicer has filed a claim against them, which can occur at any point between 270 and 360 days of nonpayment.
Note: This analysis calculated years to default from the end of borrowers’ six-month grace periods.
Sources: The Pew Charitable Trusts, Student Loan System Presents Repayment Challenges, November 2019 (https://www.pewtrusts.org/-/media/assets/2019/11/psbs_report.pdf).
Average Parent PLUS Borrowing, 1990 to 2014
In 2014 Dollars
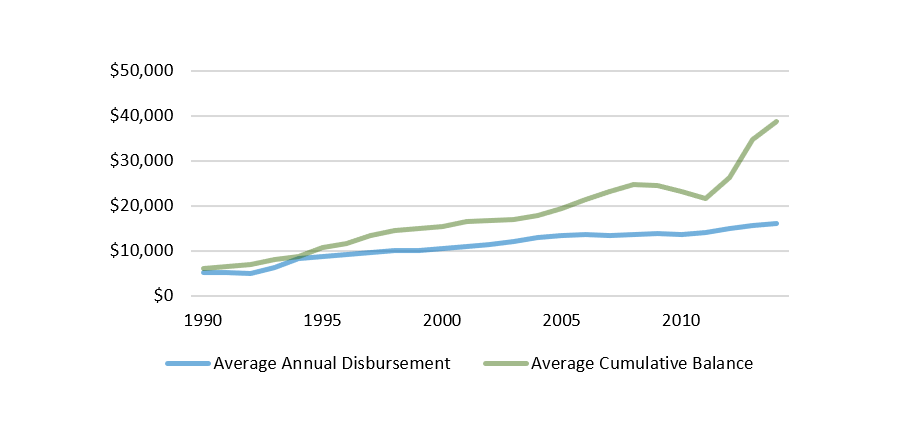
Trellis used its extensive portfolio of Federal Family Education Loan Program loans to conduct a study of 59,096 parent borrowers who entered into repayment on their loans between October 1, 2004 and September 30, 2010. The analysis found that after seven years in repayment, about eight percent of parent borrowers had defaulted, seven percent had not seen a reduction in their principal balance, and about 75 percent had reduced their principal balance by at least one dollar.
| Repayment Category | Percent | |
|---|---|---|
| Successfully Repaying | Uninterrupted Payments | 45% |
| Had Deferment, Forbearance, and/or Delinquency | 23% | |
| Had Delinquency Only | 7% | |
| Default | Had Deferment, Forbearance, and/or Delinquency | 5% |
| Had Delinquency Only | 3% | |
| No Reduction in Principal Balance | 7% | |
| Consolidation | 12% | |