
State of Student Aid in Texas – 2020
SAT Average Scores for 2019 High School Graduates
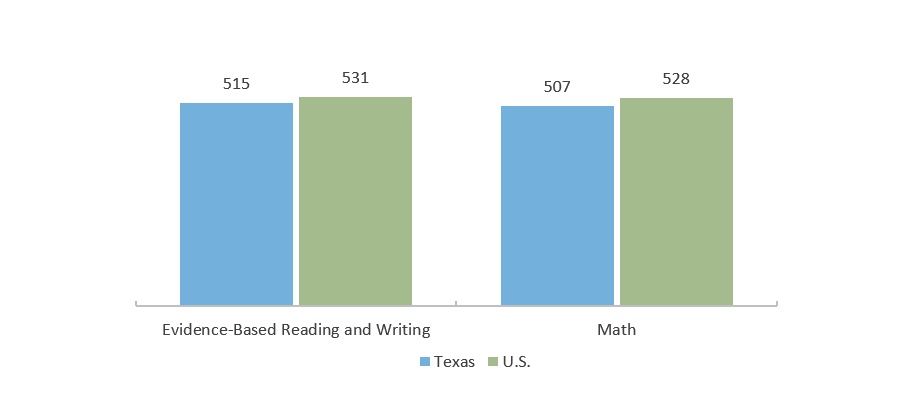
More than 200,000 Texas high school seniors and 2.2 million high school seniors nationwide — well over half the total graduating class for both groups — took the SAT in the 2018–2019 school year. Average SAT scores are lower in Texas compared to the U.S. in both Evidence-Based Reading and Writing and in Math.
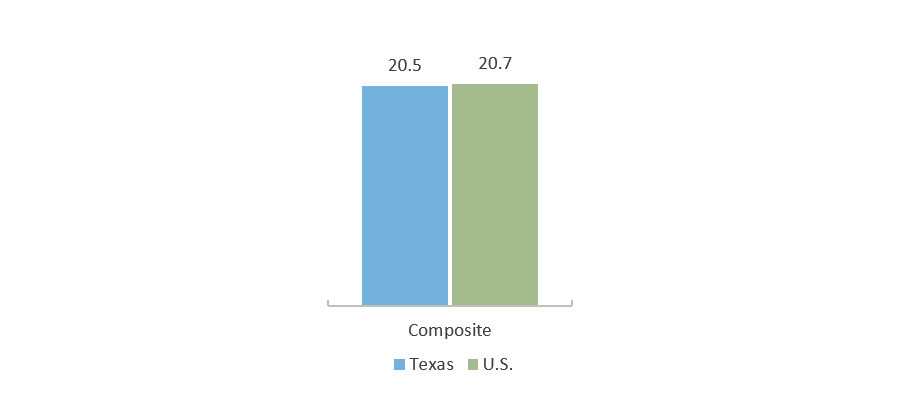
ACT Average Scores (2019)
Percent of ACT Test Takers Meeting the Benchmark,
By Subject Area (2019)
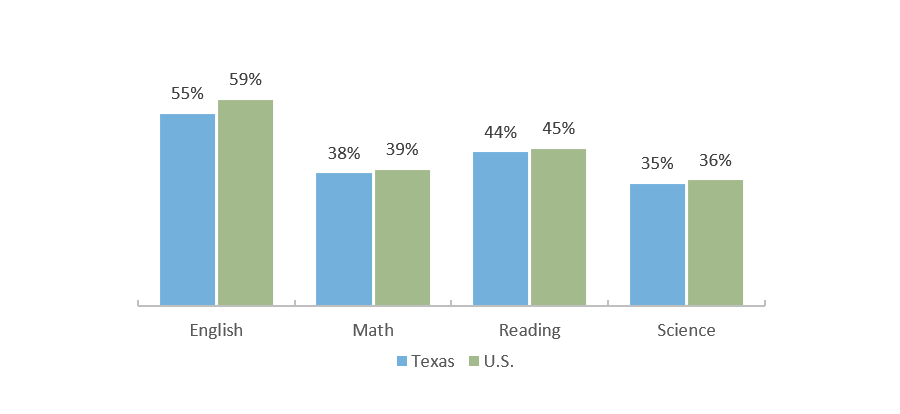
The American College Test (ACT) has fewer test takers in Texas than the SAT. Thirty-nine percent of the class of 2019 Texas high school graduates took the ACT, up from 37 percent since 2013, but down from 41 percent in 2018. Nationally, 52 percent of high school graduates took the exam. While average ACT composite scores in Texas have often lagged slightly behind national averages, the average composite score for Texas graduates has roughly mirrored that of the nation as a whole in recent few years, with slight variations in each subject area.
Source: SAT: The College Board, SAT Data & Reports, College-Bound Seniors 2019 (https://reports.collegeboard.org/pdf/2019-texas-sat-suite-assessments-annual-report.pdf; https://reports.collegeboard.org/pdf/2019-total-group-sat-suite-assessments-annual-report.pdf); ACT: ACT, National and State Scores 2019 (http://www.act.org/content/act/en/research/reports/act-publications/condition-of-college-and-career-readiness-2019.html).
PSAT/NMSQT Test Takers Who Are on Track to be College Ready (2018-2019)
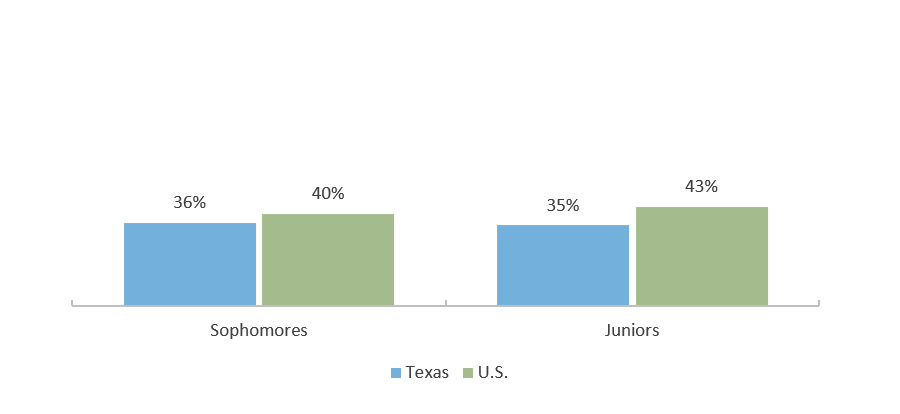
The Preliminary SAT (PSAT) and National Merit Scholar Qualifying Test (NMSQT) are taken by high school sophomores and juniors. These tests help the students prepare for the SAT and prompt them to begin planning for college. The College Board has developed college readiness benchmark scores that students should meet or exceed in order to be considered on track for college readiness. Based on this measure, Texas sophomores and juniors somewhat lag behind their national peers in college readiness.
Percent of AP Test Takers who Scored at Least a 3 on at Least One AP Test (2000 – 2018)
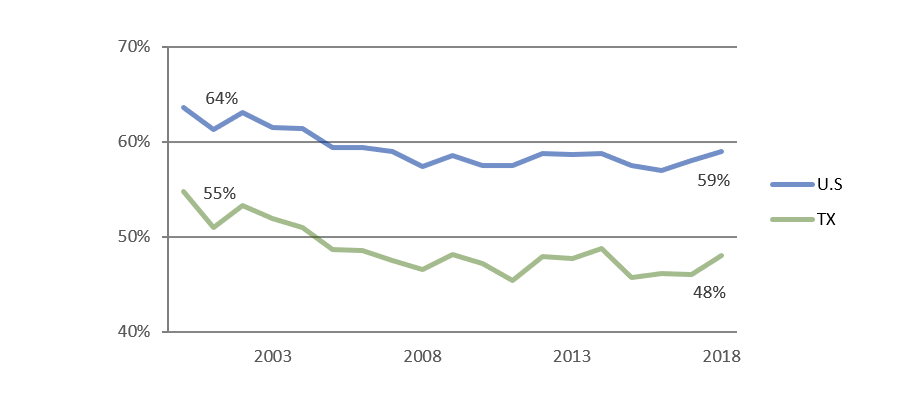
The Advanced Placement (AP) program offers more than 30 college-level courses and examinations to high school students, though a student can take an exam without having taken the course. These courses satisfy high school diploma requirements, and sufficient scores on the exams can help students gain admission to selective colleges and even earn college credit (at the institution’s discretion). Since 2005, all public higher education institutions in Texas that have freshman level courses have been required to grant credit to incoming students who earn a 3 or higher on an AP exam.
Texas trailed the nation in success rates in 2018, with 48 percent of test takers earning at least a 3 on an AP exam compared to 59 percent nationally. The percentage of AP test takers who scored at least a 3 on at least one AP test has declined both nationally and in Texas since 2000, however, the total numbers of AP test takers have also increased significantly during this time period.
Source: PSAT/NMSQT: The College Board, PSAT/NMSQT Data & Reports (https://reports.collegeboard.org/pdf/2019-texas-sat-suite-assessments-annual-report.pdf; https://reports.collegeboard.org/pdf/2019-total-group-sat-suite-assessments-annual-report.pdf); AP: The College Board, AP Program and Participation Data 2018 (https://research.collegeboard.org/programs/ap/data/archived/ap-2018).
High School Graduation Rates (2016-2017)
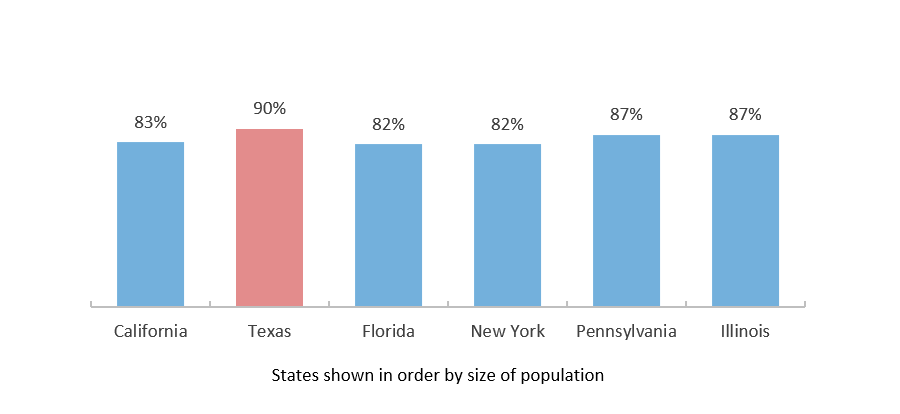
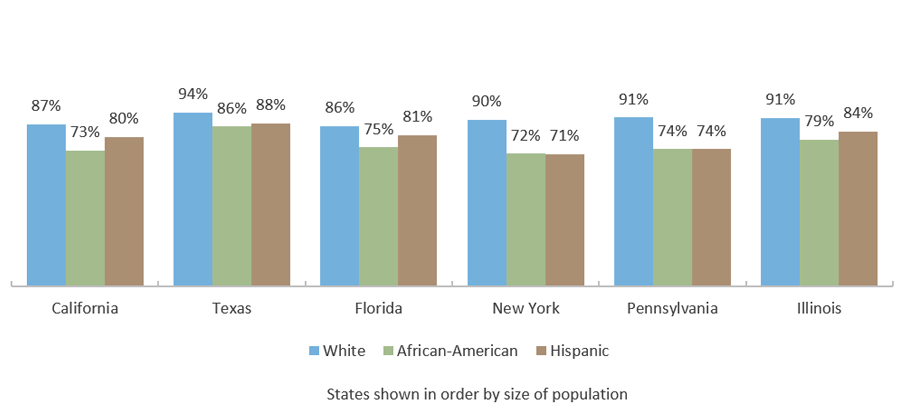
Texas ranked fifth in the nation for high school graduation rates in 2016-2017, tying with three other states at 90 percent. Texas ranked highest among the six most populous states in the nation and led the most populous states in graduation rates within racial and ethnic groups. Nationally, the overall graduation rate in 2016-2017 was 85 percent.
High School Graduation Rates, by Race/Ethnicity(2016-2017)
The recent increases in high school graduation rates have been due in part to dramatic reductions in the number of “dropout factory” high schools in the past 10 years. These schools are defined as having 60 percent or less of their ninth-grade class still enrolled in their senior year. In 2002, more than 2.6 million students were enrolled in these type “dropout factory” high schools compared to less than 900,000 in 2015.
Source: Graduation Rates: U.S. Department of Education, ED Data Express, Data about elementary and secondary schools in the U.S. (https://eddataexpress.ed.gov/); All else: America’s Promise Alliance, 2017 Building a Grad Nation Report: Progress and Challenge in Raising High School Graduation Rates (http://gradnation.americaspromise.org/report/2017-building-grad-nation-report#driver-5-low-graduation-rate-high-schools).
People Age 25 and Older Who Have Not Finished High School (2018)
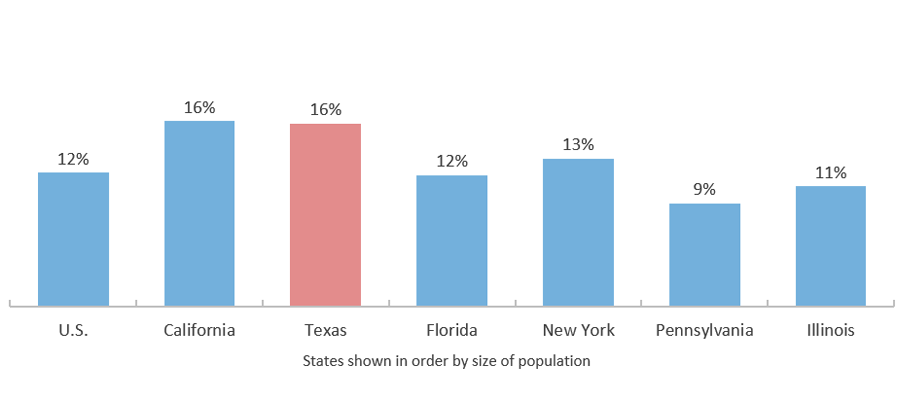
In 2018, 16 percent of people age 25 and older (or 3 million people) in Texas had not finished high school. This is the same percentage as California and a higher percentage than any other state in the nation. In the U.S., 12 percent of adults had not finished high school. However, overall high school diploma attainment in Texas is improving. Recent cohorts of Texas high school graduates rank Texas near the top compared to other states.
People Age 25 and Older Who Have Not Finished High School (2014)
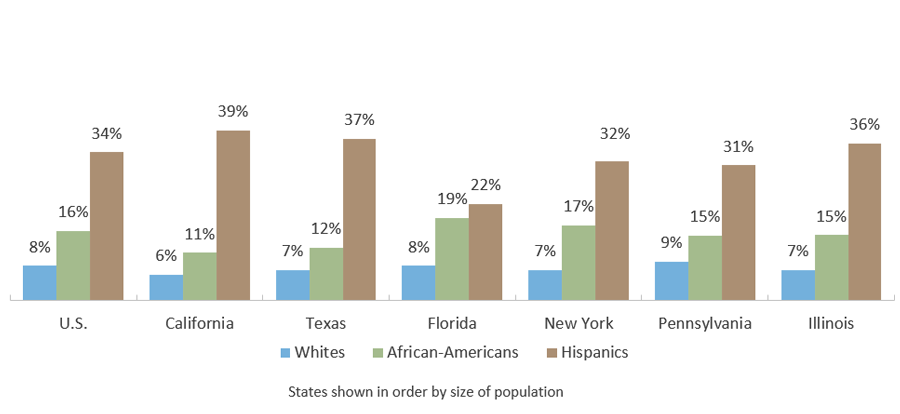
The high school completion rates of different racial and ethnic groups vary widely. Although these disparities exist in many areas of the country, they are particularly important for Texas, which has become a “minority-majority” state. At the high school level, data show that:
- Hispanics, who comprised over a third of the Texas population in 2016 and who are projected to comprise 43 percent by 2050, are the least likely to have obtained a high school diploma. As of 2016, 37 percent of Hispanics age 25 and older had not finished high school.
- Approximately 12 percent of African-Americans in Texas have not completed high school. This represents a major improvement since 2006, when 17 percent of African-Americans had not finished high school.
Source: Texas Demographic Center, Texas Population Projections Program, “Population Projections for the State of Texas and Counties in One File,” 2018 (https://demographics.texas.gov/Data/TPEPP/Projections/Index.aspx); High school completion among 25 and older: U.S. Census Bureau, 2018 American Community Survey 1-Year Estimates, Detailed Tables (http://www.census.gov/acs/www/); High school graduation rates: U.S. Department of Education, ED Data Express, Data about elementary and secondary schools in the U.S. (http://eddataexpress.ed.gov/).
Percentage of Texas High School Graduates Enrolling in College Immediately after Graduation*
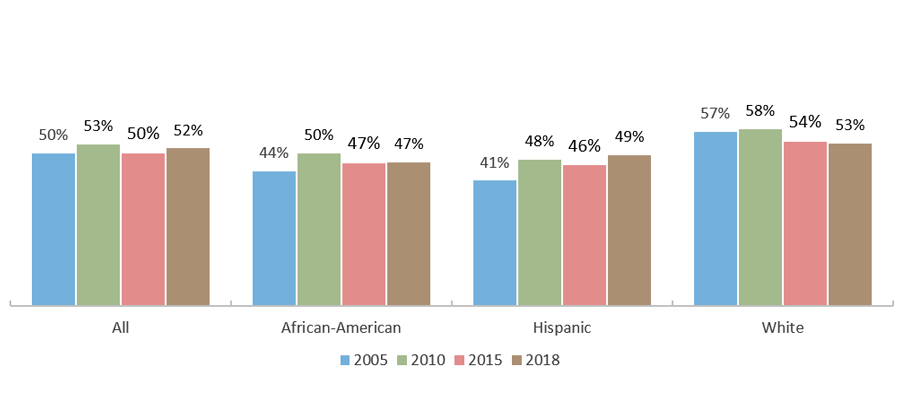
In 2000, Texas set the goal of “Closing the Gaps” in participation and success in higher education by 2015 by increasing the number of students enrolled and the number of degrees awarded. The new 15-year plan, 60x30TX, began in 2015, building on the goals and results of the “Closing the Gaps” plan.
In 2005, 50 percent of all Texas high school graduates entered college in the summer or fall immediately after high school graduation. This increased to 54 percent in 2009, but steadily declined each year from 2010-2017, falling back to 50 percent by 2017. In 2018, there was a slight increase to 52 percent. This overall trend holds for the individual racial/ethnic groups – the rates peaked in 2009 and then fall slightly each year after until 2017, with some experiencing slight increases in 2018.
The percentage of White students who enroll immediately after high school still exceeds the percentage of non-Whites; however, this gap is closing. There was a 16-percentage point gap between White students and Hispanic students in 2005. This shrank to four percentage points in 2018 due both to rising college enrollment rates among Hispanic students and dropping rates among White students. The gap between African-American and White students has also been closing. The straight-to-college pathway traditionally results in higher postsecondary attainment rates compared to delaying college entry after high school graduation.
* Includes only Texas high school graduates who enrolled in a Texas public or private, nonprofit college or university. Data on students who enrolled at proprietary institutions or enrolled in out-of-state schools are not available. In AY 2007–2008, about 93 percent of Texas students who enrolled in college immediately after high school graduation were attending school in their state of residence.
Source: “Closing the Gaps” goals: Texas Higher Education Coordinating Board (THECB) Closing the Gaps. October 2000 (http://www.thecb.state.tx.us/reports/PDF/0379.PDF?CFID=11742258&CFTOKEN=38987795 ); Texas high school students enrolling in college immediately after graduation: Texas Higher Education Coordinating Board (THECB) High School to College Linkages, 2017, “High School Graduates Enrolled in Higher Education the Following Fall: State Summary by Ethnicity and Higher Education Sector, Fall 2000 to Fall 2018” (http://www.txhighereddata.org/index.cfm?objectId=77D62E90-D970-11E8-BB650050560100A9)
Percentage of 2017-18 Texas High School Graduates Enrolled in Texas Higher Education in Fall 2018, by Ethnicity
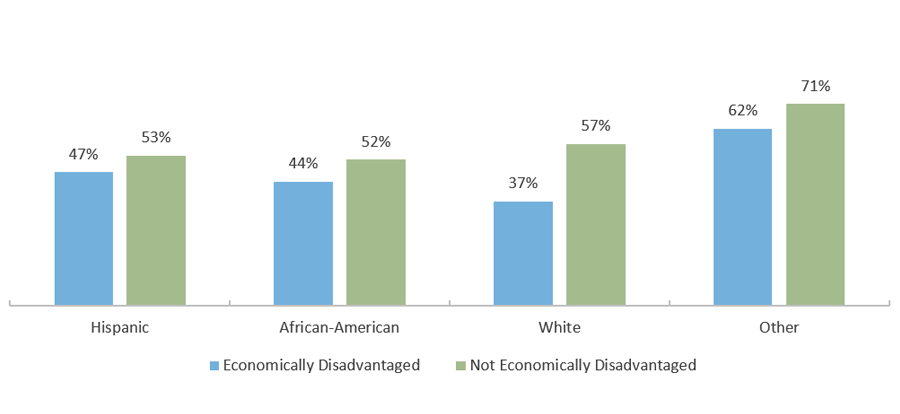
Economically disadvantaged* high school graduates in Texas are less likely to directly enroll in college. This is true across all racial and ethnic categories but is especially pronounced for White students.
Number of 2017-18 Texas High School Graduates, by Ethnicity
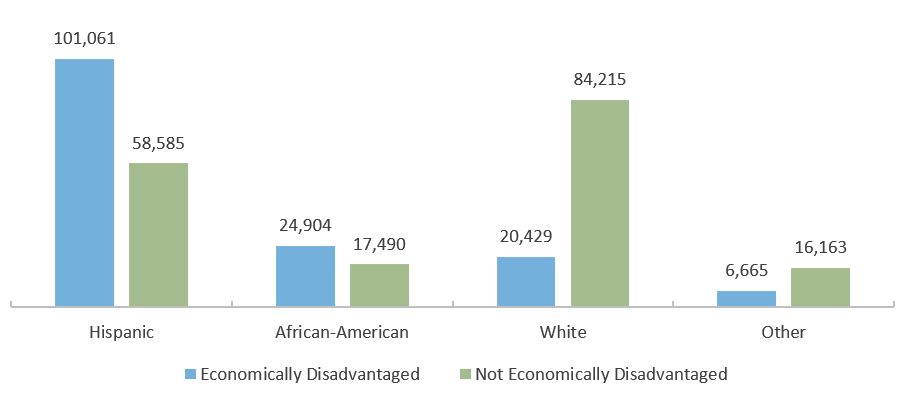
Only 20 percent of White high school graduates in Texas are considered to be economically disadvantaged, while 63 percent of Hispanic and 59 percent of African-American high school graduates are considered economically disadvantaged.
*The Texas Education Agency (TEA) collects data on whether a student is “economically disadvantaged” based on the student’s eligibility for free or reduced lunch as a proxy for family income. The TEA does not have detailed information about family income.
Source: The Texas Higher Education Coordinating Board, “2017-2018 High School Graduates Enrolled in Higher Education Fall 2018, by Diploma Type and Ethnicity” (unpublished tables).
Fall 2018 FAFSA Completion Rate by Region*
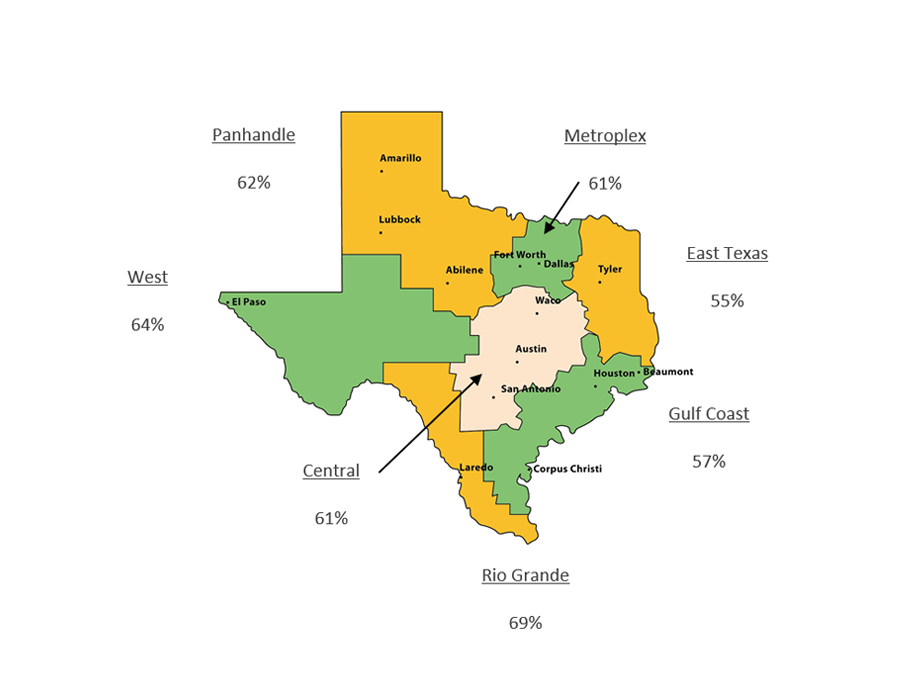
The Free Application for Federal Student Aid (FAFSA) is the standardized financial aid application used by nearly all colleges and universities to award most types of financial aid. By completing the FAFSA, students and their families have access to more financial options and can make more informed decisions about attending college.
Starting in the 2020-2021 school year, Texas will become the second state in the nation to require high school seniors to submit a FAFSA application before graduating. Louisiana started requiring this step last year and has since ranked first among states in FAFSA completion, experiencing a 25 percent increase over the previous year. Texas is hoping to see a boost that will help more students obtain the financial aid they qualify for and help more students feel confident that they can afford to attend college.
The statewide FAFSA completion rate was 61 percent in fall 2019 and varied from 55 percent in the East Texas region to 69 percent in the Rio Grande Valley region. Many Texas communities promote FAFSA completion to encourage college enrollment, which, in turn, strengthens the skills in their local labor markets. The Rio Grande Valley region, a close-knit community, has been relatively successful in their efforts. Many of the high schools have college admissions specialists on campus, and FAFSA completion work is championed by district leadership.
* Fall 2019 represents the class of 2018-2019 high school seniors completing the FAFSA as of September 20, 2019.
Source: U.S. Department of Education, Office of Federal Student Aid, FAFSA Completion by High School (http://studentaid.ed.gov/about/data-center/student/application-volume/fafsa-completion-high-school). Number of high school seniors from Texas Education Agency (special request); FAFSA Requirement for High School Seniors: Inside Higher Ed, Making the FAFSA Mandatory (July 10, 2019) (https://www.insidehighered.com/news/2019/07/10/texas-becomes-second-state-require-fafsa-completion); Rio Grande Valley FAFSA efforts: learned via communication with the Austin Chamber of Commerce.
Percent of 2016-17 Texas High School Graduates, Enrolled in Texas Higher Education in Fall 2017 that Met All TSI Standards
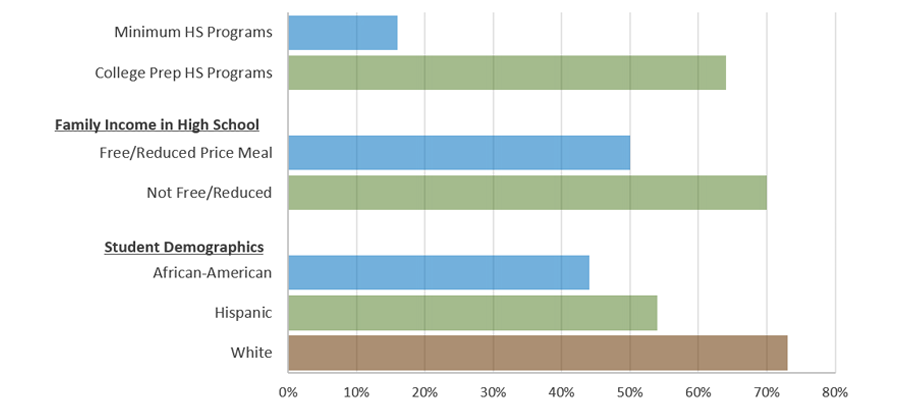
The Texas Success Initiative (TSI) was created by the state to help colleges and universities assess the college-readiness of incoming students in reading, writing, and math. To meet TSI standards, students either score high enough on an approved TSI assessment or complete an approved TSI exemption (e.g., scoring above a threshold on the SAT, ACT, or TAKS tests, or completing college-level coursework). Students who do not meet TSI standards may be required to complete developmental coursework – courses that often do not count towards a certificate or degree program – before enrolling in college-credit courses.
Of all 2016-17 high school graduates who enrolled in higher education the following fall, 61 percent met TSI standards in math, writing, and reading. However, the percentages of high school students who met all TSI standards varied widely when comparing key characteristics. Students who enrolled in higher education after completing the minimum high school diploma program were far less likely to meet TSI standards than students who completed the College Prep* diploma. Sixty-four percent of students in the College Prep diploma program met all TSI standards, compared to just 16 percent of those completing the minimum diploma program.
Low-income high school graduates were also less academically prepared for college than their peers. Fifty percent of students who received free or reduced-price meals in high schools – a common, though imperfect, metric to identify low-income students – met all TSI standards. In contrast, 70 percent of students who did not receive free or reduced-price meals met all TSI standards. College readiness measures also varied based on student demographics. Seventy-three percent of White students met all TSI standards, compared to 54 percent of Hispanic students and 44 percent of African-American students.
*A high school student who graduates under either the Recommended or Distinguished achievement program is considered to have a College Prep diploma for the purposes of this analysis, and a graduate of the Foundation or Minimum achievement program is considered a Minimum program. The Recommended and Distinguished programs require more completed credits (26) in mathematics, science, social studies, language other than English, and fine arts than the minimum program. The Minimum program has fewer required completed credits (22).