
State of Student Aid in Texas – 2020
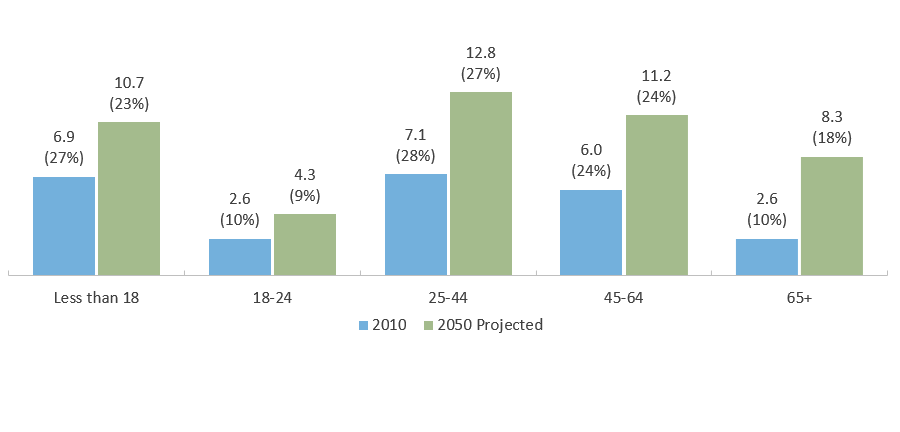
Texas Population by Age in Millions and Percentage of Total in Each Year: 2010 and 2050 (Projected*)
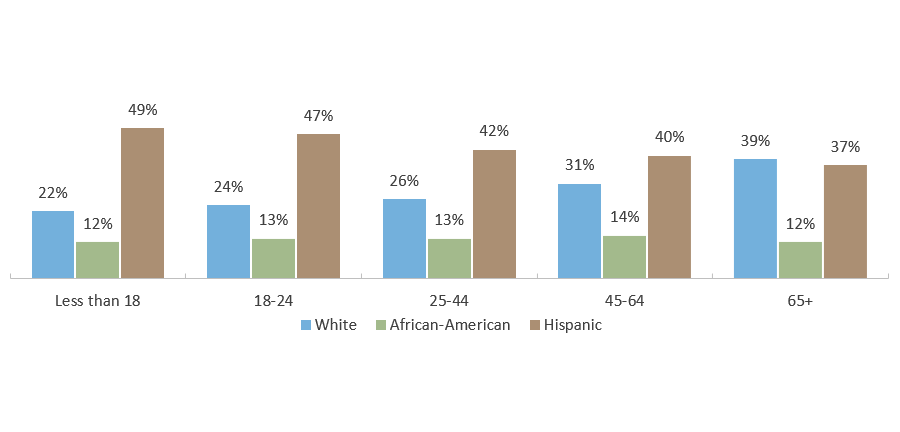
Projected* 2050 Population by Age and Ethnicity in Texas
From 2010 to 2050, Texas is expected to add 3.8 million more children under age 18 and 1.7 million more adults aged 18 to 24 — the traditional college age population. The population age 25 to 64 will grow by almost six million, while the numbers of those aged 65 and older will swell by more than five million. Despite the increase in the number of children and young adults, people age 24 and younger will actually drop as a percentage of the population, from 28 percent to 27 percent. Meanwhile, people age 65 and older will increase from 10 percent to 18 percent.
As Texas changes from a majority-White to majority-Hispanic state, and experiences an increase in the percentage of the elderly population, a significant difference emerges with respect to population by age. In 2050, 49 percent of children, 47 percent of 18- to 24-year-olds, and 42 percent of 25- to 44-year-olds will be Hispanic. By contrast, only 37 percent of those 65 and older will be Hispanic. The African-American population will remain relatively stable, at 12 percent to 14 percent of each age group. Increasingly, the future of Texas, including its economic prosperity, as well as the expertise needed to run business, government, and infrastructure, will depend on the education of its non-White populations, which historically have had lower incomes, higher rates of poverty, and lower likelihood of attending and completing college than Whites.
Source: Texas Demographic Center, “Texas Population Projections Program: 2018 Population Projections”, Population Projections for State of Texas by Age Group (https://demographics.texas.gov/Data/TPEPP/Projections/ ).
People Without Health Insurance, Large States (2018)
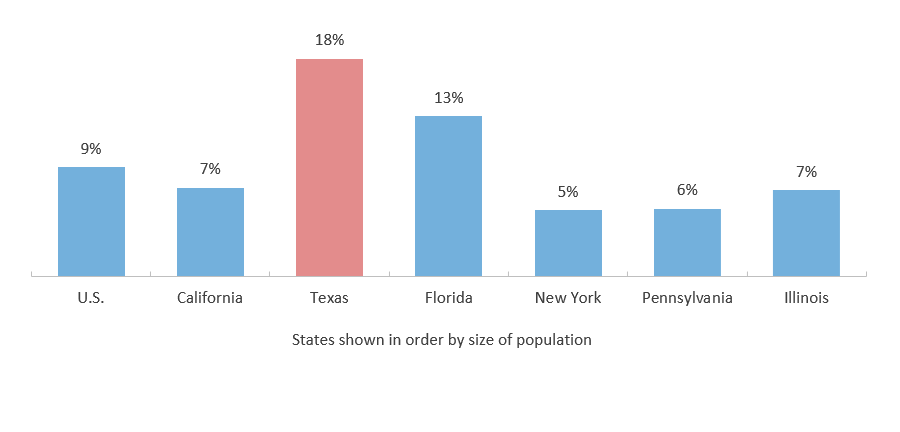
About nine percent of Americans lacked health insurance in 2018. The percentage is much higher in Texas. At 18 percent, Texas is approximately twice the national average. It has the highest percentage of any state, with Oklahoma coming in second at 14 percent.
Family health crises can be unpredictable, and the resulting financial disruption can derail college plans. While financial aid administrators can make mid-year adjustments using professional judgement, this requires students to make a formal appeal, and adjustments may still be insufficient to help the student stay in school.
Source: U.S. Census Bureau, “Health Insurance Coverage in the United States: 2018”, (https://www.census.gov/library/publications/2019/demo/p60-267.html).
People in Poverty, States with Highest Rates (2018)
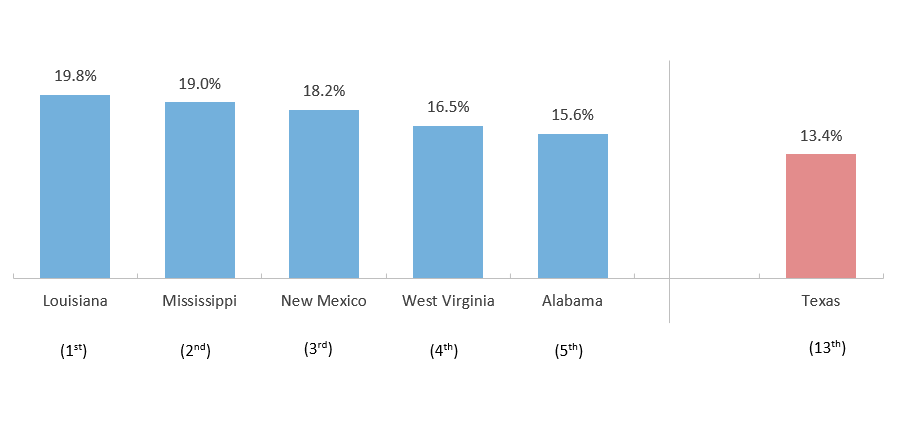
The prevalence of people in the U.S. living in poverty declined from 13.1 percent in 2016 to 12 percent in 2018. While Texas has the thirteenth highest poverty rate in the nation and a poverty rate higher than the national average, it saw its poverty rate drop by 0.9 percentage points during this time period. These data pre-date the COVID-19 pandemic, which has had a detrimental impact on poverty for people across the country. In 2019, poverty was defined as having an income of $25,926 or less for a family of four with two children, or $13,300 or less for an individual under 65 years old.
People in Poverty, Largest States (2018)
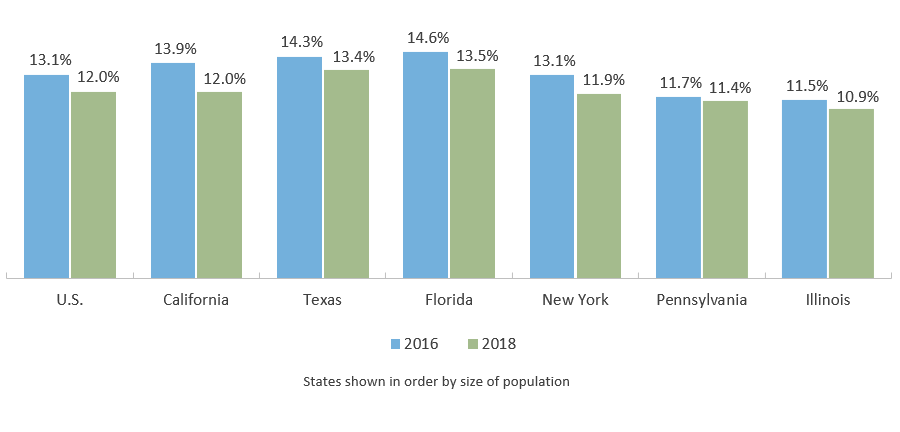
At 13.4 percent, Texas has the second highest poverty rate among the six largest states, preceded by Florida at 13.5 percent. All of the six largest states and the nation overall saw a decrease in poverty rate between 2016 and 2018.
Source: U.S. Census Bureau, “Percentage of People in Poverty by State Using 2- and 3-Year Averages: 2015-2016 and 2017-2018” (https://www.census.gov/library/publications/2019/demo/p60-266.html); Definition of Poverty: U.S. Census Bureau, “Poverty Thresholds: 2019” (https://www.census.gov/data/tables/time-series/demo/income-poverty/historical-poverty-thresholds.html)
Poverty Rate by Region (2018)
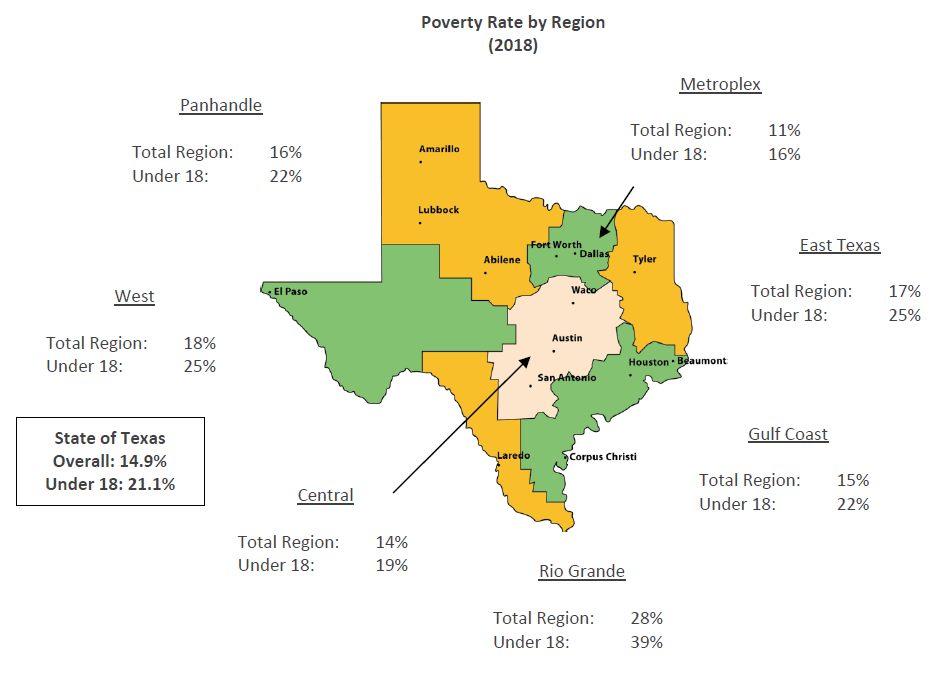
The 2018 poverty rate in Texas was 14.9 percent overall and 21.1 percent for children under 18; however, these rates vary widely by region. By a large margin, the Rio Grande region has the highest rates of overall and childhood poverty at 28 and 39 percent respectively – at least 11 percentage points higher than the next highest region. The Metroplex region had the lowest rates of poverty at 11 percent overall and 16 percent for those under 18. In all regions, the poverty rate for children was higher than for the total population.
In 2019, poverty was defined as having an income of $25,926 or less for a family of four with two children, or $13,300 or less for an individual under 65 years old.
Sources: Definition of Poverty: U.S. Census Bureau, “Poverty Thresholds: 2019” (https://www.census.gov/data/tables/time-series/demo/income-poverty/historical-poverty-thresholds.html); Poverty rates by region: U.S. Department of Agriculture, Economic Research Service, “Poverty estimates for the U.S., States, and counties, 2018” (http://www.ers.usda.gov/data-products/county-level-data-sets/download-data.aspx).
Percent Change in Child Homelessness from School Year 2015-16 to School Year 2017-18
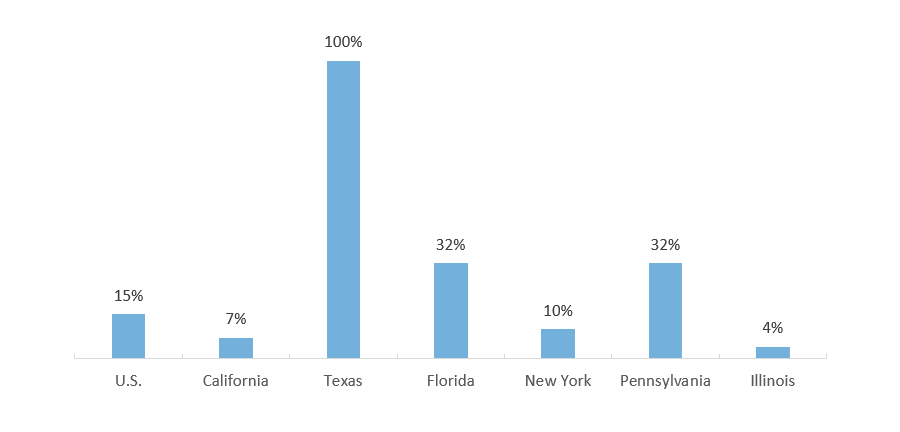
Texas had more than 230,000 homeless students enrolled in school in school year 2017-2018, double the number of enrolled homeless students in school year 2015-2016. This was a huge change compared to other large states and compared to the nation, likely due to the devastating impact of Hurricane Harvey in September 2017. Funding through the Federal Emergency Management Agency (FEMA) was insufficient to cover the costs of the extreme destruction of the natural disaster in the immediate aftermath, extending homelessness for many families.
Nationwide, more than 1.5 million enrolled students were homeless during school year 2017-2018. Homeless students face struggles and barriers that students who are not homeless do not face – limited access to digital resources, difficulty finding a space to study, potential transportation issues, and inadequate resources to be involved in school or extra-curricular activities, among other things. The added stress of taking care of basic needs can make it a challenge to focus on academics and reach the students’ full learning potential.