State of Student Aid in Texas – 2021
Texas’ Future Depends on Addressing Educational Equity
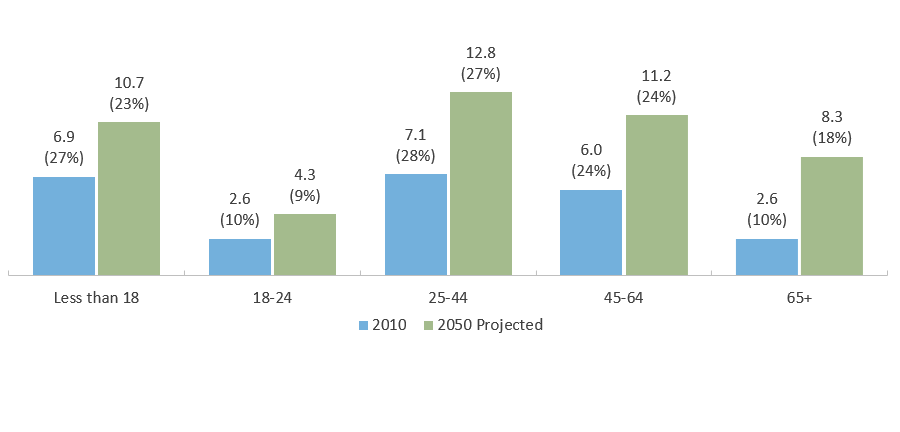
Texas Population by Age in Millions and Percentage of Total in Each Year: 2010 and 2050 (Projected*)
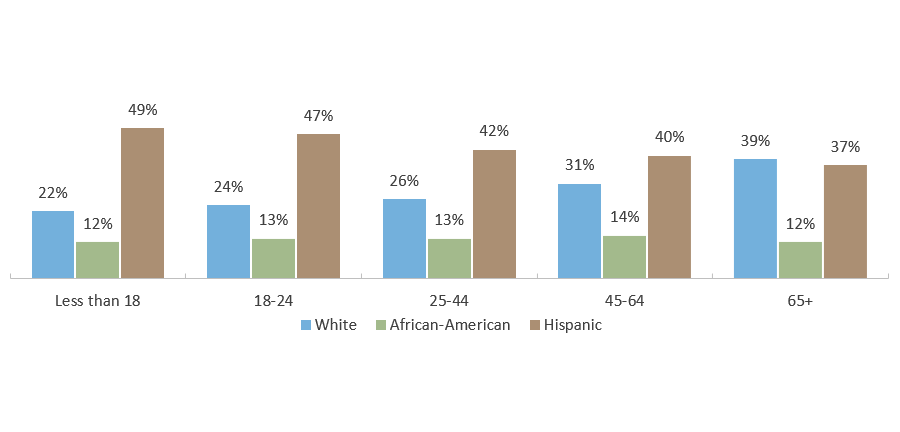
Projected* 2050 Population by Age and Ethnicity in Texas
Source: Texas Demographic Center, “Texas Population Projections Program: 2018 Population Projections”, Population Projections for State of Texas by Age Group (https://demographics.texas.gov/Data/TPEPP/Projections/ ).
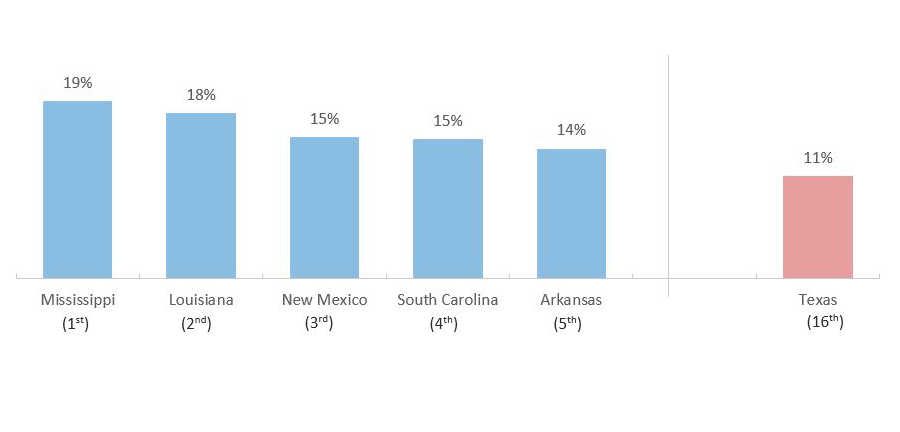
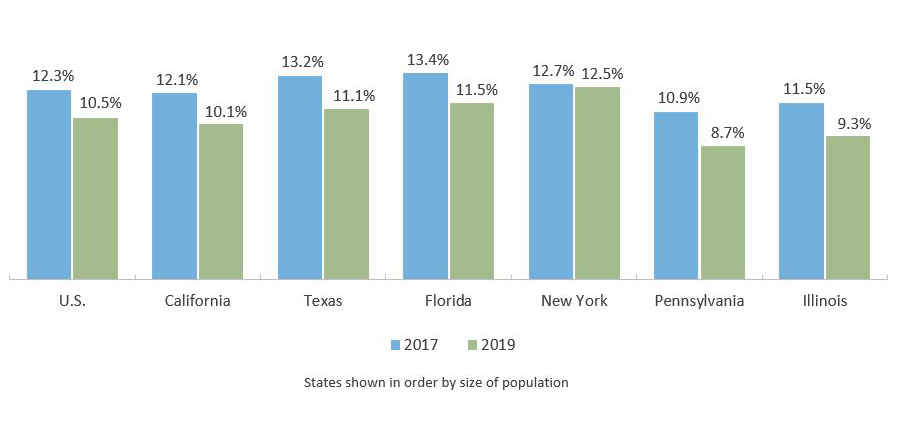
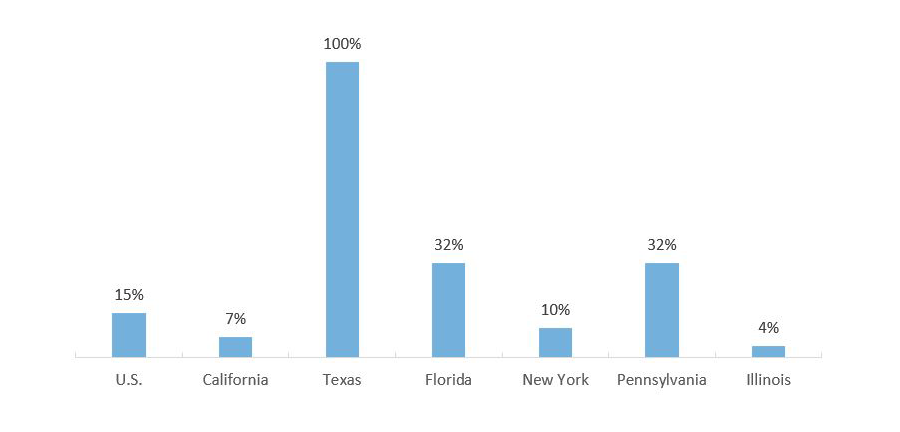
Texas Poverty Rate Declines, but Still Higher Than National Average
People in Poverty, States with Highest Rates (2019)
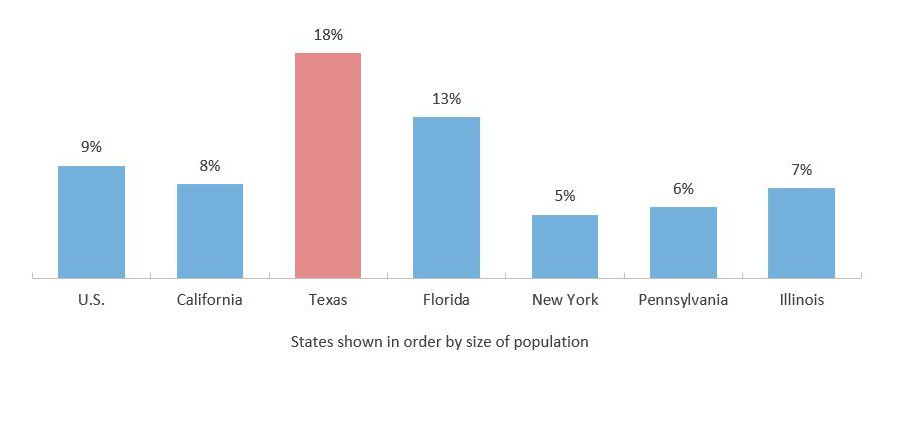
People in Poverty, Largest States (2019)
Source: Texas Demographic Center, “Texas Population Projections Program: 2018 Population Projections”, Population Projections for State of Texas by Age Group (https://demographics.texas.gov/Data/TPEPP/Projections/ ).
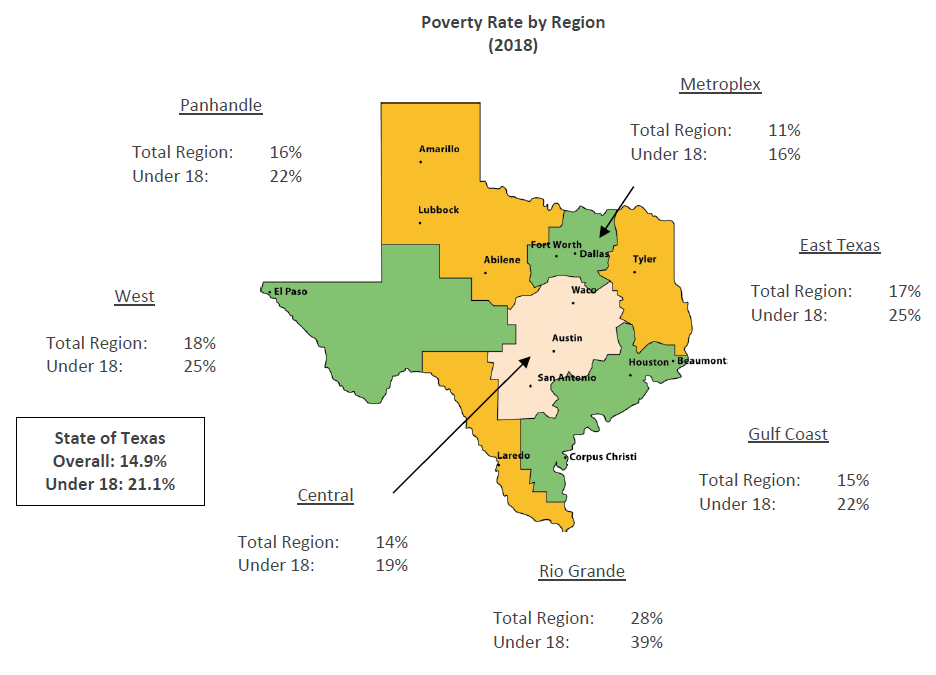
Texas Poverty Rates Vary Widely by Region
Poverty Rate by Region (2018)
Source: Definition of Poverty: U.S. Census Bureau, “Poverty Thresholds: 2019” (https://www.census.gov/data/tables/time-series/demo/income-poverty/historical-poverty-thresholds.html); Poverty rates by region: U.S. Department of Agriculture, Economic Research Service, “Poverty estimates for the U.S., States, and counties, 2018” (http://www.ers.usda.gov/data-products/county-level-data-sets/download-data.aspx).
Texas Experiences Largest Increase in Homelessness Among Children Enrolled in School
Percent Change in Child Homelessness from School Year 2015-16 to School Year 2017-18
Source: Impact of Hurricane Harvey: Newsweek, Ballesteros, C. November 26, 2017, “Hurricane Harvey Victims: More than 20,000 Children in Houston are Homeless, Report Shows” (https://www.newsweek.com/hurricane-harvey-victims-homeless-fema-722640); Impact of Hurricane Harvey: Houston Chronicle, Ward, A. 2018, “Homeless after Harvey: For some, the historic flooding in Houston washed away shelters and security” (https://www.houstonchronicle.com/news/houston-weather/hurricaneharvey/article/Homeless-after-Harvey-For-some-the-historic-13171309.php); All Other: National Center for Homeless Education, “Federal Data Summary, School Years 2015-16 Through 2017-18, Education for Homeless Children and Youth” (https://nche.ed.gov/wp-content/uploads/2020/01/Federal-Data-Summary-SY-15.16-to-17.18-Published-1.30.2020.pdf).
Lack of Health Insurance Destabilizes Finances, Makes College-Going Precarious
People Without Health Insurance, Large States (2019)