State of Student Aid in Texas – 2021
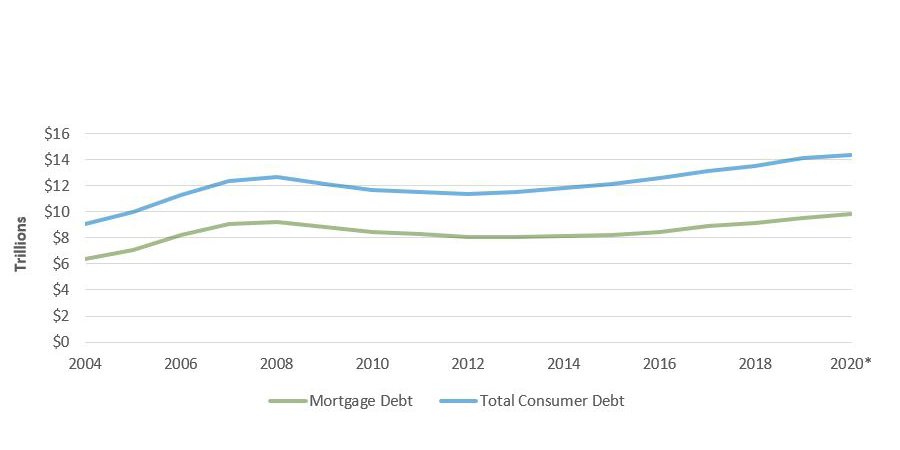
Total U.S. Consumer Debt Reaches $14.3 Trillion, Student Loan Debt $1.5 Trillion
Total U.S. Consumer Debt Balance and Mortgage Debt Balance in Trillions of Dollars, Over Time, 2004-2020*
U.S. Consumer Debt Balances in Trillions of Dollars (Non-Mortgage), Over Time, 2004-2020*
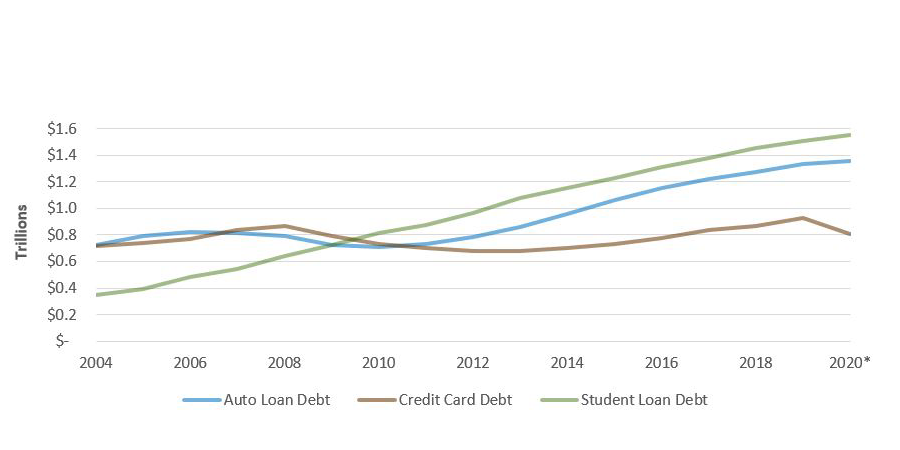
*All data are as of the fourth quarter of each year except 2020, where the most current data is as of the third quarter.
Sources: Federal Reserve Bank of New York, The Center for Microeconomic Data, Data & Reports, 2020 Q3 (https://www.newyorkfed.org/microeconomics/data.html).
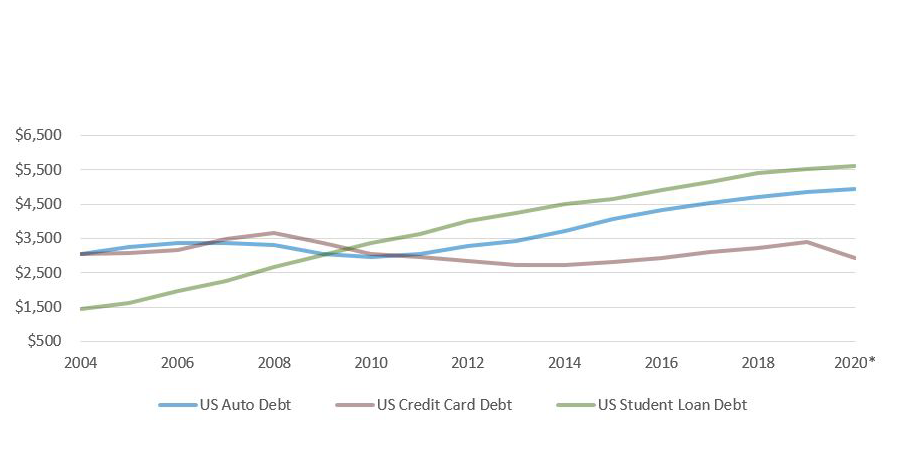
Unlike the Nation, Texas Student Debt per Capita has not Surpassed Auto Debt
U.S. Non-Mortgage Consumer Debt per Capita, 2004-2020*
Texas Non-Mortgage Consumer Debt per Capita, 2004-2020*
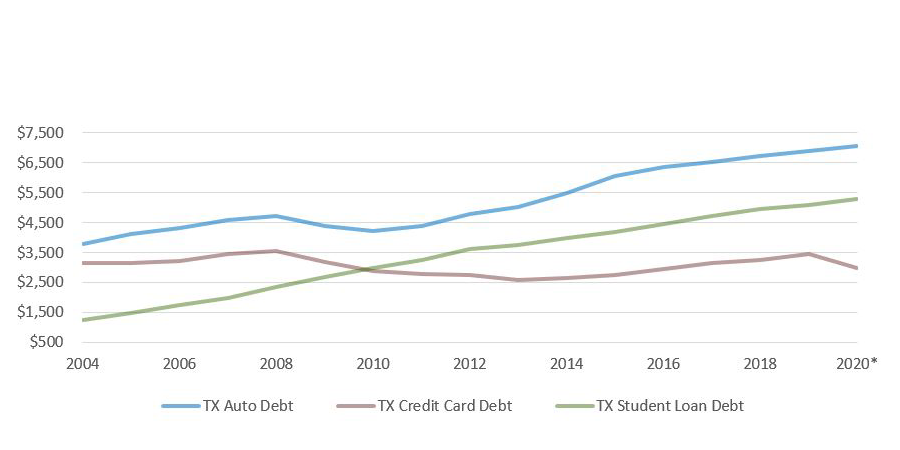
*All data are as of the fourth quarter of each year except 2020, where the most current data is as of the third quarter.
Sources: Federal Reserve Bank of New York, The Center for Microeconomic Data, Data & Reports, 2020 Q3 (https://www.newyorkfed.org/microeconomics/data.html).
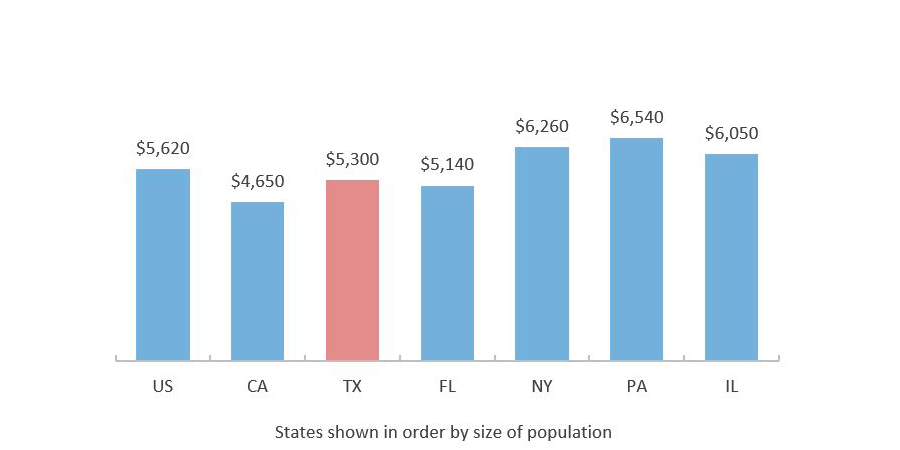
Texas Student Loan Balance Per Capita Lower Than National Average
Student Loan Debt Balance per Capita by State, 2020 Q3
Total Debt Balance per Capita by State, 2020 Q3
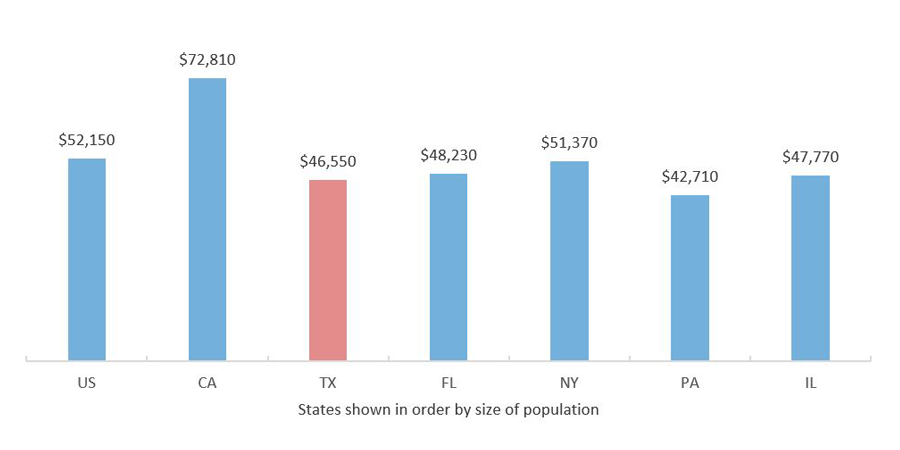
Sources: Federal Reserve Bank of New York, The Center for Microeconomic Data, Data & Reports, 2020 Q3 (https://www.newyorkfed.org/microeconomics/data.html).
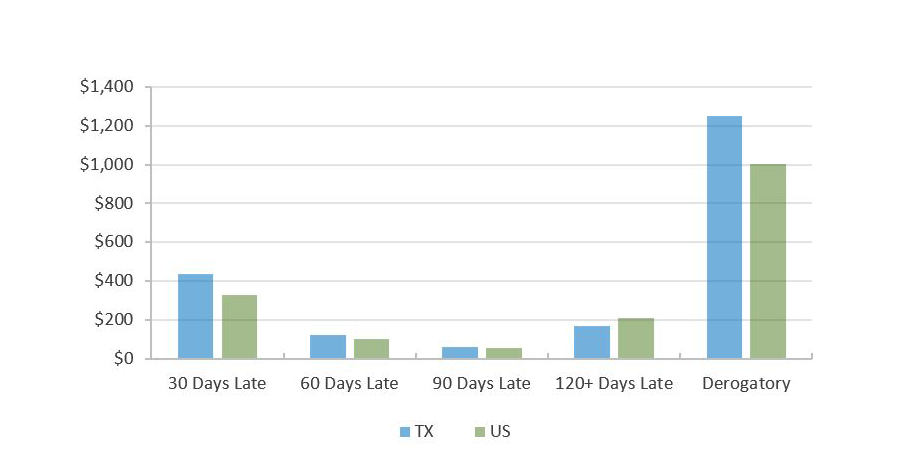
The Nation Sees Decreases in Severely Delinquent Balances as the CARES Act Offers Some Relief During Pandemic
Delinquency Status of Debt per Capita by State, 2020 Q3
Percentage of Balance 90+ Days Late by State, 2019 and 2020
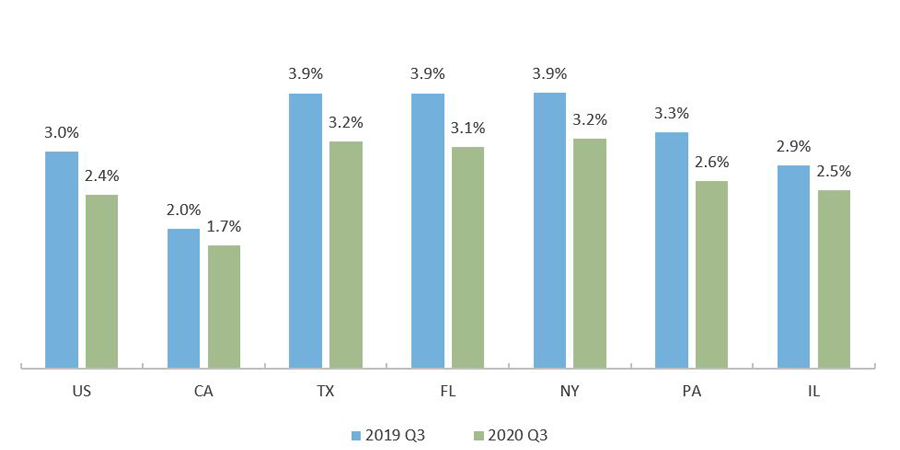
Note: The Derogatory delinquency status includes a person with any level of delinquency combined with repossession, charge off to bad debt, or foreclosure.
Sources: Federal Reserve Bank of New York, The Center for Microeconomic Data, Data & Reports, 2020 Q3 (https://www.newyorkfed.org/microeconomics/data.html).
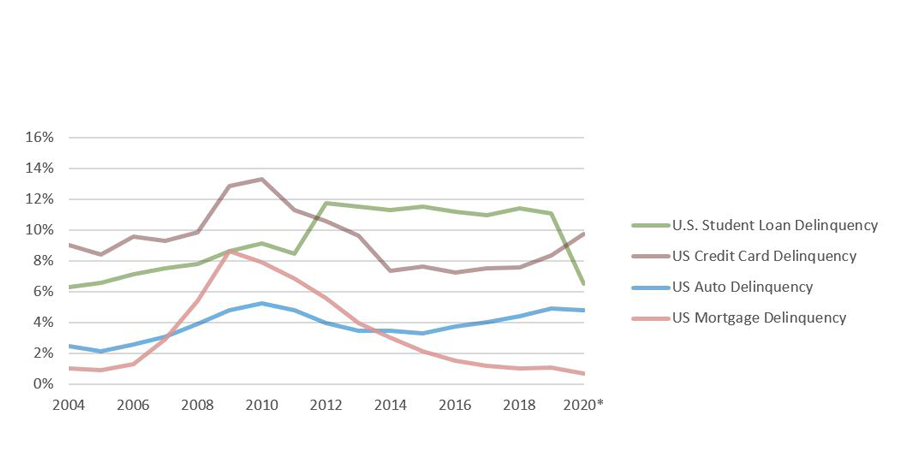
Severe Delinquency for Student Loan Borrowers Surpassed Credit Cards in 2012 in Texas and the Nation
Percent of U.S. Consumer Debt Balance 90+ Days Delinquent, Over Time, 2004-2020*
Percent of Texas Consumer Debt Balance 90+ Days Delinquent, Over Time, 2003-2019
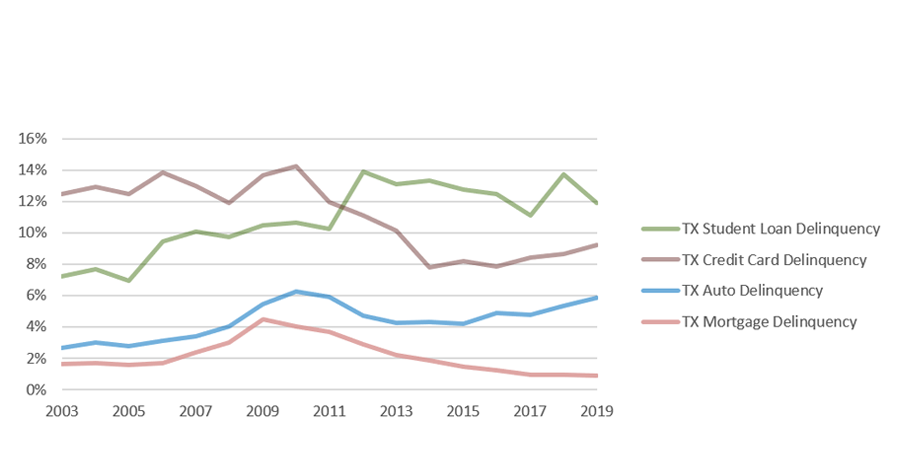
* All data are as of the fourth quarter of each year except 2020, where the most current data is as of the third quarter.
Sources: Federal Reserve Bank of New York, The Center for Microeconomic Data, Data & Reports, 2020 Q3 (https://www.newyorkfed.org/microeconomics/data.html).
Delinquent Balances for Student Loan Debt Decreases Dramatically in 2020 Due to COVID-19 Pandemic Relief Measures
New 90+ Days Delinquent Loan Balances in Billions of Dollars (Non-Mortgage), Over Time, 2003-2020*
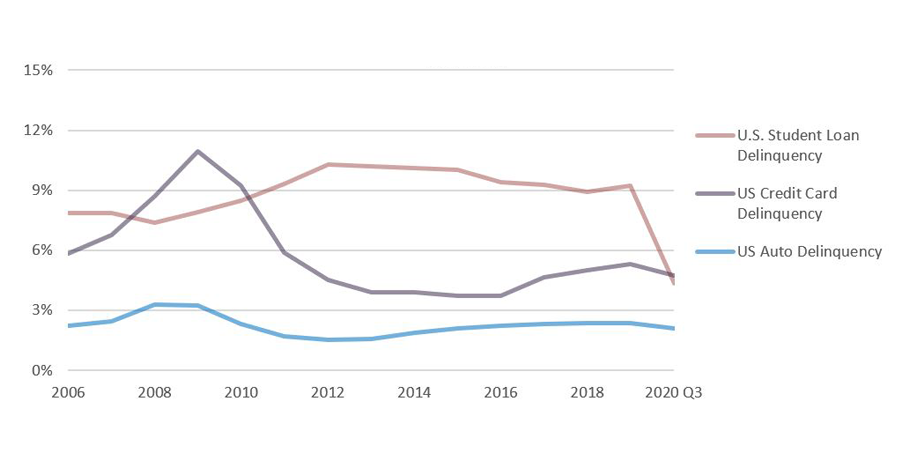
* All data are as of the fourth quarter of each year except 2020, where the most current data is as of the third quarter.
Sources: Federal Reserve Bank of New York, The Center for Microeconomic Data, Data & Reports, 2020 Q3 (https://www.newyorkfed.org/microeconomics/data.html).
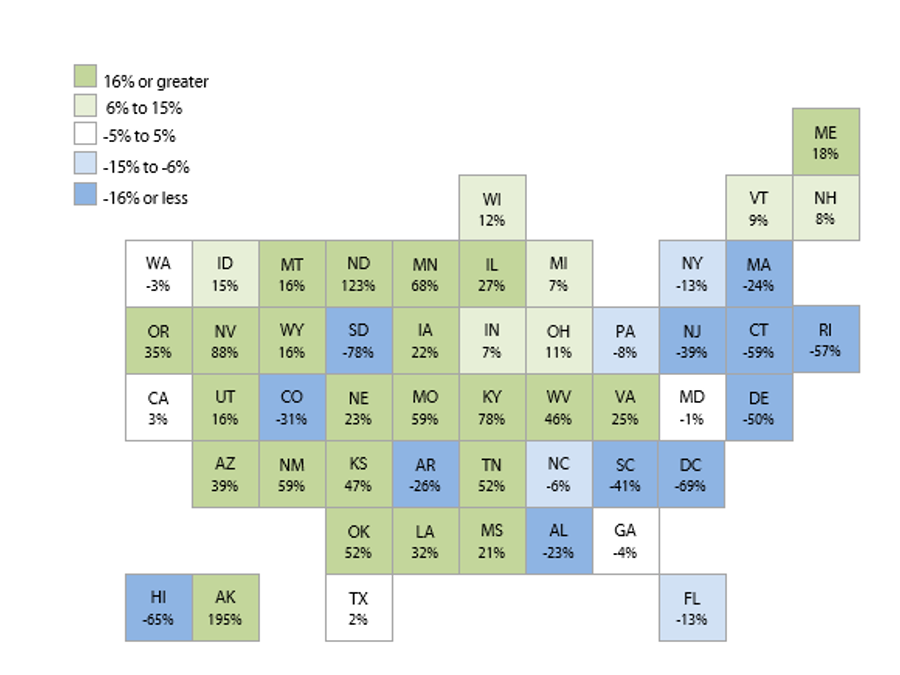
Majority of States Saw Increases in Student Lending Activity From 2017 to 2018
One Year Change in Student Loan Volume, by State, (July 2017 to July 2018)