
State of Student Aid in Texas – 2021
Progress on 60x30TX Goals
60x30TX Goal Updates
| 2015 (Baseline) | 2018 | 2030 Goal | ||
|---|---|---|---|---|
| Overall Attainment Rate | 40.3% | 43.5% | 60% | |
| Completion Goals | Overall Completion Total | 311,340 | 341,307 | 550,000 |
| Hispanic Completion | 96,657 | 115,735 | 285,000 | |
| African American Completion | 38,964 | 41,594 | 76,000 | |
| Male Completion | 131,037 | 143,981 | 275,000 | |
| Economically Disadvantaged Completion | 114,176 | 124,471 | 246,000 | |
| Texas High School Graduates Enrolling in Texas Higher Education | 52.7% | 51.6% | 65% | |
| Marketable Skills Goal | Working or Enrolled Within One Year | 78.9% | 78.5% | 80% |
| Student Debt Goals | Student Loan Debt to First-Year-Wage Percentage | 59.5% | 59% | 60% |
| Excess SCH Attempted | 19 | 16 | 3 | |
| Percent of Undergraduates Completing with Debt | 49.2% | 45.8% | 50% |
Sources: Texas Higher Education Coordinating Board. THECB 60×30 Progress Report, July 2019 (http://www.60x30tx.com/media/1518/2019-60x30tx-progress-report.pdf).
Higher Education Highlights from the 86th Legislative Session
HB 3: Relating to Public School Finance and Public Education
- Requires that high school students complete and submit a Federal Application for Federal Student Aid (FAFSA) or a Texas Application for State Financial Aid (TASFA) prior to graduation
HB 2140: Relating to Creating an Electronic Application System for State Student Financial Assistance
- Requires the Texas Higher Education Coordinating Board to develop a process that would allow students to complete the Texas Application for State Financial Aid online on the same website as the common admission application form
HB 3808: Relating to Measures to Facilitate the Timely Graduation of and Attainment of Marketable Skills by Students in Public Higher Education
- Requires specified changes to the Texas College Work-Study Program, the Texas WORKS Internship Program, and the filing of a degree plan to aid in timely graduation and acquiring marketable skills
- Requires that public institutions designate a liaison officer for current and incoming students to provide them with comprehensive information about support services and other available resources
HB 2784: Relating to the Creation of the Texas Industry-Recognized Apprenticeship Programs Grant Program
- Requires the Texas Workforce Commission to create and administer a program to encourage the private sector to develop apprenticeship programs
- No funding was appropriated with this bill
Sources: Texas Higher Education Coordinating Board (THECB), Legislative and Media Resources, Higher Education Policy and Appropriations, “Summary of Higher Education Legislation, 86th Texas Legislature” (2019) (http://reportcenter.thecb.state.tx.us/training-materials/presentations/board-legislation-2019-summary/).
Funding for TEXAS Grant and TEG Increase for FY 2020 and FY 2021
Major Texas Financial Aid Programs, Appropriated Funds by State Program and State Fiscal Year*
| State Fiscal Year 2019 | State Fiscal Year 2020 | State Fiscal Year 2021 | |
|---|---|---|---|
| Towards EXcellence Access and Success (TEXAS) Grant | $393.2 | $433.2 | $433.2 |
| Texas Educational Opportunity Grant (TEOG) | $47.9 | $47.9 | $47.9 |
| Texas College Work-Study | $9.4 | $9.4 | $9.4 |
| Tuition Equalization Grant (TEG) | $85.9 | $89.3 | $89.3 |
| B-on-Time Loan | $3.8 | $1.2 | $0 |
Other Large Texas Financial Aid Programs, Appropriated Funds by State Program and State Fiscal Year*
| State Fiscal Year 2019 | State Fiscal Year 2020 | State Fiscal Year 2021 | |
|---|---|---|---|
| Developmental Education | $1.3 | $1.3 | $1.3 |
| Texas Research Incentive Program | $17.5 | $17.5 | $17.5 |
| Professional Nursing Shortage Reduction Program | $9.9 | $9.9 | $9.9 |
| Teach for Texas Loan Repayment Assistance Program | $1.3 | $1.3 | $1.3 |
| Physician Education Loan Repayment Program | $12.6 | $15.3 | $14.9 |
| Texas Armed Services Scholarship | $1.3 | $3.4 | $3.4 |
| Math and Science Scholar’s Loan Repayment Program | $1.2 | $1.2 | $1.2 |
*The Texas state fiscal year is September 1 through August 31.
Sources: Legislative Budget Board, State Budget by Program “86th Regular Session, Final Bill” (http://sbp.lbb.state.tx.us/).
Student Loan Debt in Texas Grows Faster Than the U.S.; Reaches $114 Billion
Estimated Outanding Student Debt in Texas (in billions*)
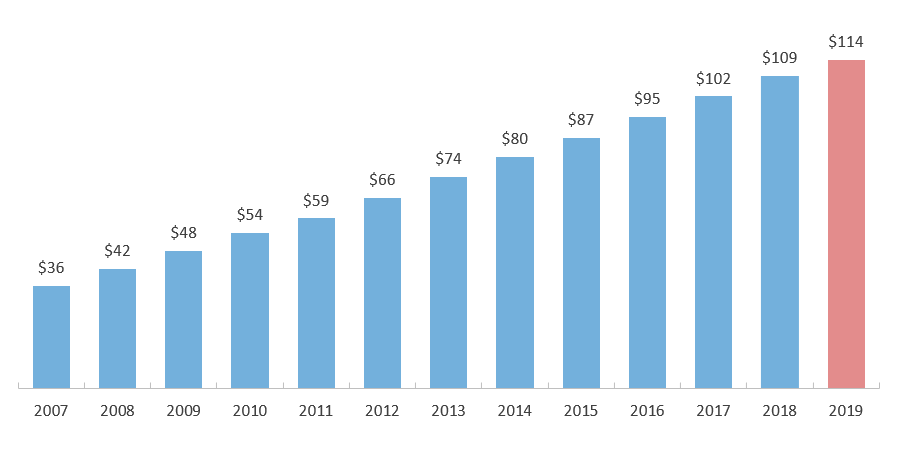
*Estimates are based on state-level per capita student debt averages from the Federal Reserve Bank of New York Consumer Credit Panel, which excludes persons without credit reports and persons living in counties where fewer than 10,000 people have credit reports. The result for a given year is adjusted by the same factor by which the result of this methodology for the United States as a whole deviates from the United States total outstanding student debt for that year as reported in the Quarterly Report on Household Debt and Credit. This adjustment, which was not made in some previous editions of SOSA, has been applied to all years.
**The FFEL Program ended in 2010, but borrowers are still making payments on outstanding FFEL balances.
Sources: U.S. Student Loan Debt Estimate: Federal Reserve Bank of New York (FRBNY), Quarterly Report on Household Debt and Credit, 2019:Q4 (https://www.newyorkfed.org/microeconomics/hhdc/background.html), Texas Student Loan Debt Estimate: FRBNY Quarterly Report on Household Debt and Credit, Q4 2007 through Q4 2018, and Household Debt and Credit Statistics by State (https://www.newyorkfed.org/microeconomics/databank.html); Non-federal borrowing: College Board. Trends in Student Aid 2019 (https://trends.collegeboard.org/student-aid/figures-tables/total-federal-and-nonfederal-loans-over-time).
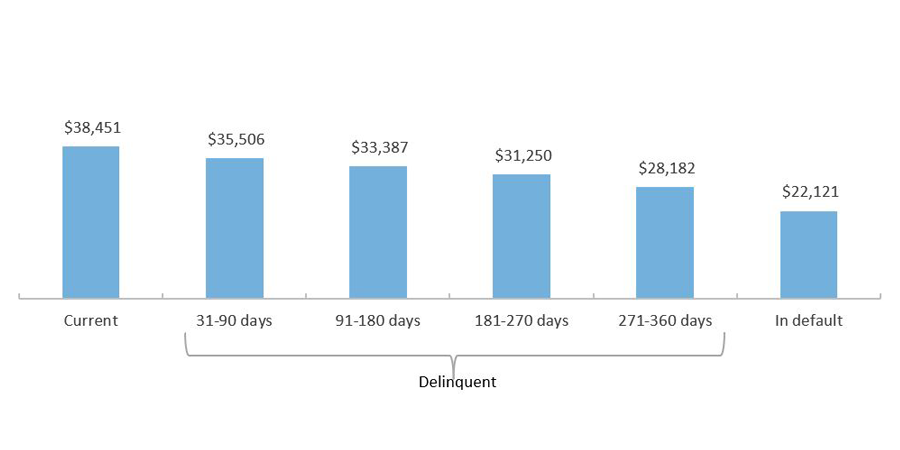
Students Who Borrow More Are Less Likely to Default
National Average Loan Balance by Loan Status for Federal Direct Loans (Current dollars; as of Q2 2020)
*Estimates are based on state-level per capita student debt averages from the Federal Reserve Bank of New York Consumer Credit Panel, which excludes persons without credit reports and persons living in counties where fewer than 10,000 people have credit reports. The result for a given year is adjusted by the same factor by which the result of this methodology for the United States as a whole deviates from the United States total outstanding student debt for that year as reported in the Quarterly Report on Household Debt and Credit. This adjustment, which was not made in some previous editions of SOSA, has been applied to all years.
**The FFEL Program ended in 2010, but borrowers are still making payments on outstanding FFEL balances.
Sources: U.S. Department of Education, Student Aid Data, Federal Student Loan Portfolio, “Direct Loan Portfolio by Delinquency Status (DL, ED-Held FFEL, ED-Owned)” (https://studentaid.gov/data-center/student/portfolio); Cohort default rate: U.S. Department of Education, “Official Cohort Default Rates for Schools”, (http://www2.ed.gov/offices/OSFAP/defaultmanagement/cdr.html); Lifetime default projection: U.S. Office of Management and Budget, FY 2017 Budget for Dept of Education, (https://www.whitehouse.gov/sites/default/files/omb/budget/fy2017/assets/edu.pdf); 12-year default study: Woo, J. et al (2017). Repayment of Student Loans as of 2015 Among 1995-96 and 2003-04 First-Time Beginning Students. NCES. (https://nces.ed.gov/pubs2018/2018410.pdf).
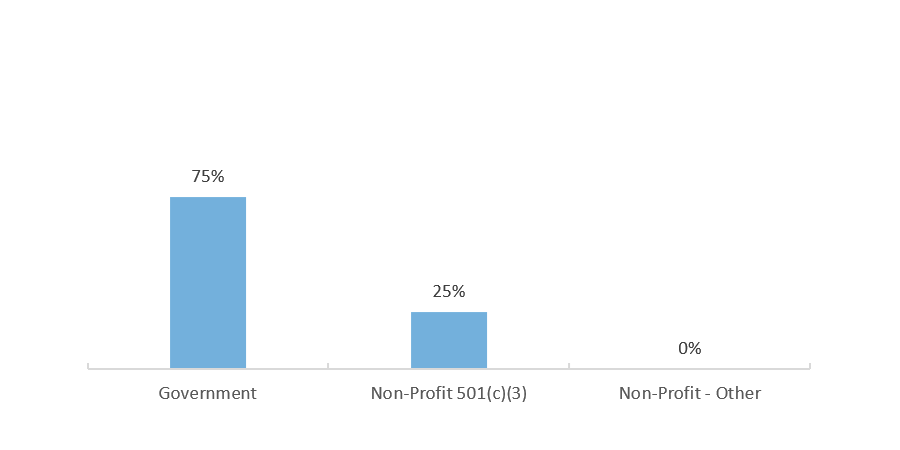
Most Borrowers Approved for Federal Public Service Loan Forgiveness are Government Employees
Approved PSLF Applications by Employer Type
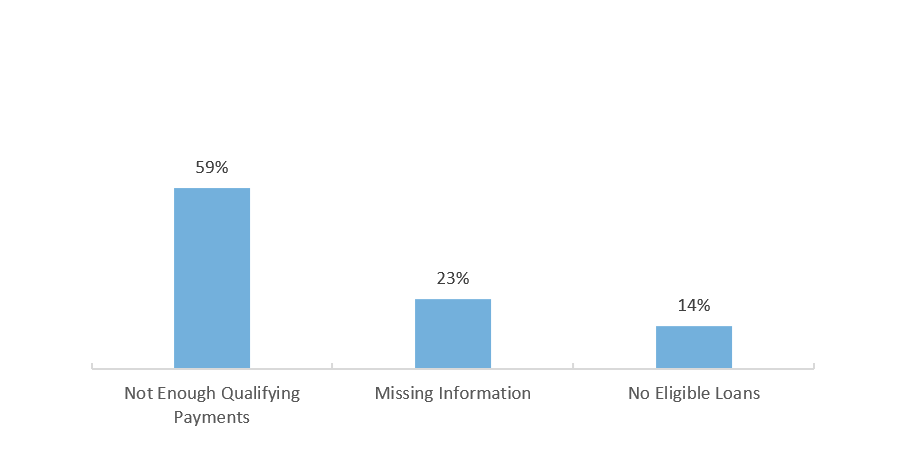
Most Common Reasons for Ineligible PSLF Applications
Sources: U.S. Department of Education, Federal Student Aid, Public Service Loan Forgiveness Data: https://studentaid.gov/data-center/student/loan-forgiveness/pslf-data; U.S. House Committee of Education and the Workforce, PROSPER Act: https://www.congress.gov/bill/115th-congress/house-bill/4508.
COVID-19 Legislation Aims to Help Higher Education Institutions and Students
Federal Aid for Higher Education at Texas Institutions
| CARES Act | Consolidated Appropriations Act | |
|---|---|---|
| Student aid | $511,010,443 | $505,497,586 |
| Institutional Assistance | $511,010,443 | $1,225,520,018 |
Sources: CARES Act Text of Bill (https://www.nasfaa.org/uploads/documents/CARES_Act_Final_Text.pdf); Student Loan Payment Delay: MarketWatch.com, “$2 trillion coronavirus stimulus package lets some student-loan borrowers delay payments for six months” (https://www.marketwatch.com/story/2-trillion-coronavirus-stimulus-bill-gives-student-loan-borrowers-six-months-of-relief-2020-03-26); Extended Student Loan Payment Delay: U.S. Department of Education, Federal Student Aid, “Coronavirus and Forbearance Info for Students, Borrowers, and Parents (Coronavirus and Forbearance Info for Students, Borrowers, and Parents | Federal Student Aid); Consolidated Appropriations Act: National Association of Student Financial Aid Administrators, “Congress Releases Bipartisan Year-End Spending Deal, FAFSA Simplification, COVID Relief, and Other Student Aid Provisions (NASFAA | Congress Releases Bipartisan Year-End Spending Deal, FAFSA Simplification, COVID Relief, and Other Student Aid Provisions)
CARES Act Allocations in Texas Regions
CARES Act Allocations at Texas Institutions by Region
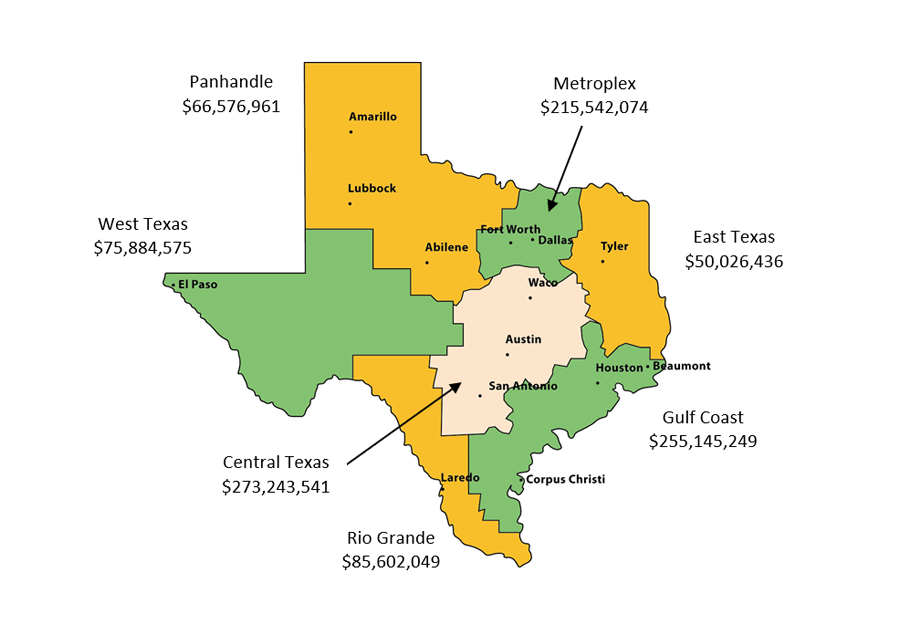
CARES Act Allocations at Texas Institutions by Region
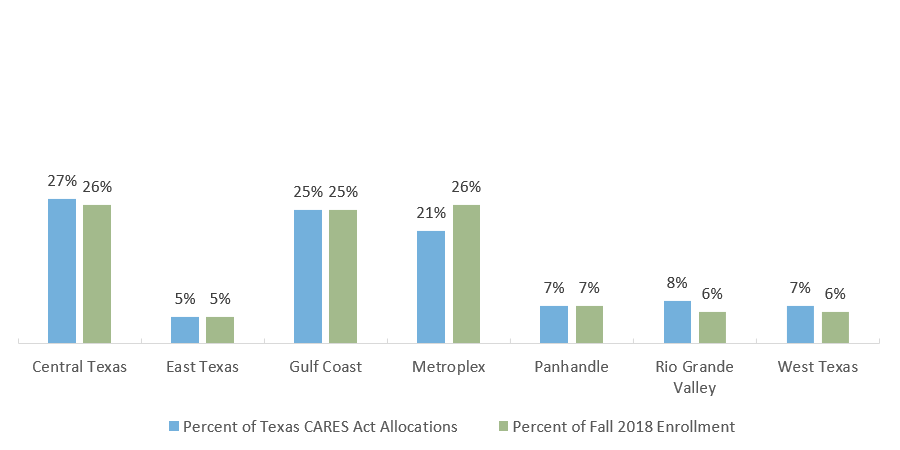
Sources: U.S. Department of Education, Allocations for Section 18004(a)(1) of the CARES Act (https://www2.ed.gov/about/offices/list/ope/allocationsforsection18004a1ofcaresact.pdf); Enrollment by Region: U.S. Department of Education, National Center for Education Statistics, IPEDS Data (http://www.nces.ed.gov/ipeds/).
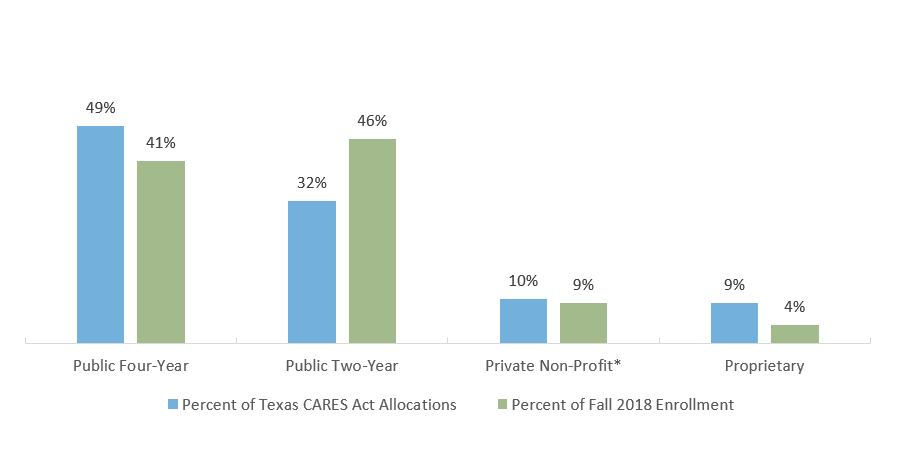
CARES Act Allocations Vary by Sector in Texas
CARES Act Allocations at Texas Institutions by Sector
| School Type | Total Allocations | Number of Institutions |
|---|---|---|
| Public Four-Year | $500,029,127 | 43 |
| Private Non-Profit* | $105,694,744 | 68 |
| Pubic Two-Year | $328,113,876 | 64 |
| Proprietary | $88,183,138 | 121 |
*This category includes 4-year or above, 2-year, and less-than 2-year institutions. Ninety percent of the Private Non-Profit Texas institutions receiving allocations are 4-year or above.
Sources: U.S. Department of Education, Allocations for Section 18004(a)(1) of the CARES Act (https://www2.ed.gov/about/offices/list/ope/allocationsforsection18004a1ofcaresact.pdf); Enrollment by Sector: U.S. Department of Education, National Center for Education Statistics, IPEDS Data (http://www.nces.ed.gov/ipeds/).
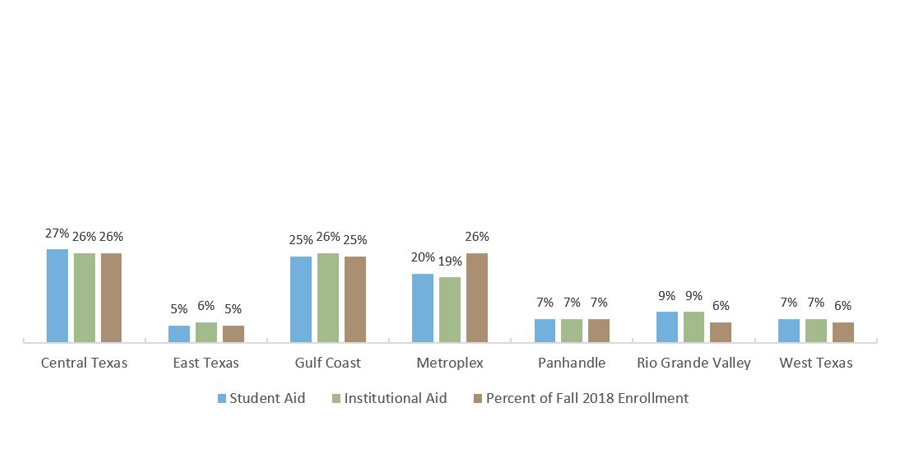
Consolidated Appropriations Act Allocates Aid to Areas of Greatest Need
Consolidated Appropriations Act Allocations at Texas Institutions by Region
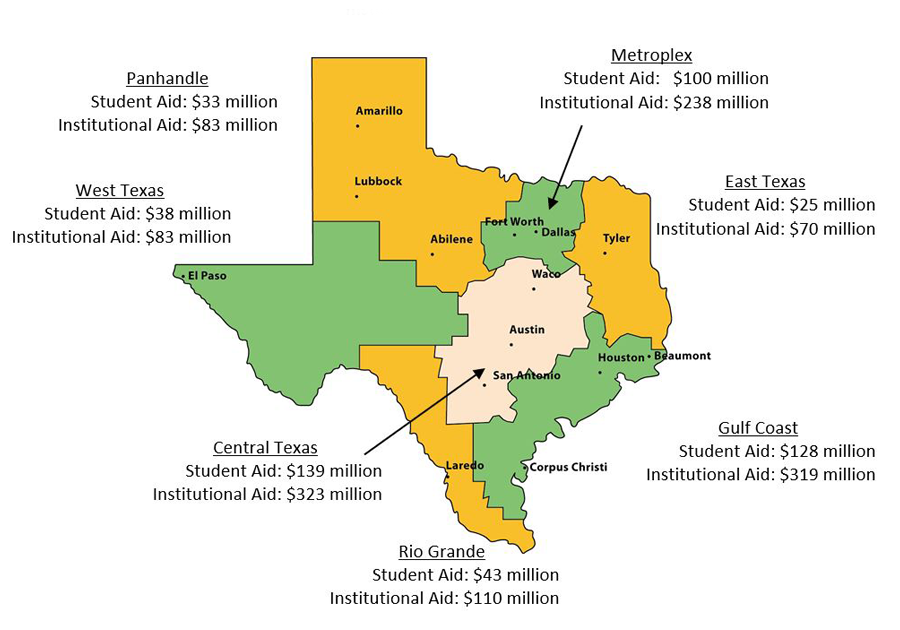
Consolidated Appropriations Act Allocations at Texas Institutions by Region
Sources: Consolidated Appropriations Act Allocations: U.S. Department of Education, “CRRSAA: Higher Education Emergency Relief Fund (HEERF II) (https://www2.ed.gov/about/offices/list/ope/ccrrsaa.html); Enrollment by Sector: U.S. Department of Education, National Center for Education Statistics, IPEDS Data (http://www.nces.ed.gov/ipeds/).
Consolidated Appropriations Act Channels Relief Disproportionately to Public Four-Year Sector
Consolidated Appropriations Act Allocations at Texas Institutions by Sector
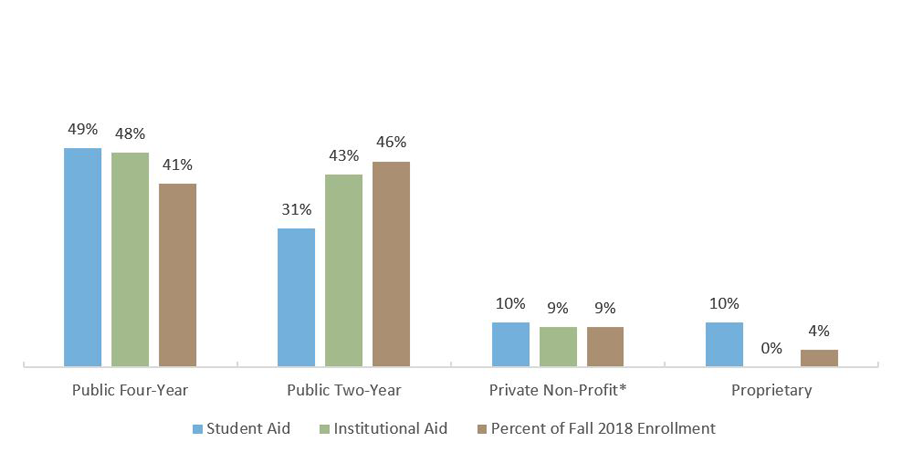
| School Type | Student Aid | Institutional Aid | Number of Institutions |
|---|---|---|---|
| Public Four-Year | $249,298,069 | $583,481,183 | 43 |
| Private Non-Profit* | $52,743,033 | $115,313,898 | 67 |
| Pubic Two-Year | $154,034,029 | $526,724,937 | 57 |
| Proprietary | $49,422,455 | $0 | 126 |