State of Student Aid in Texas – 2021
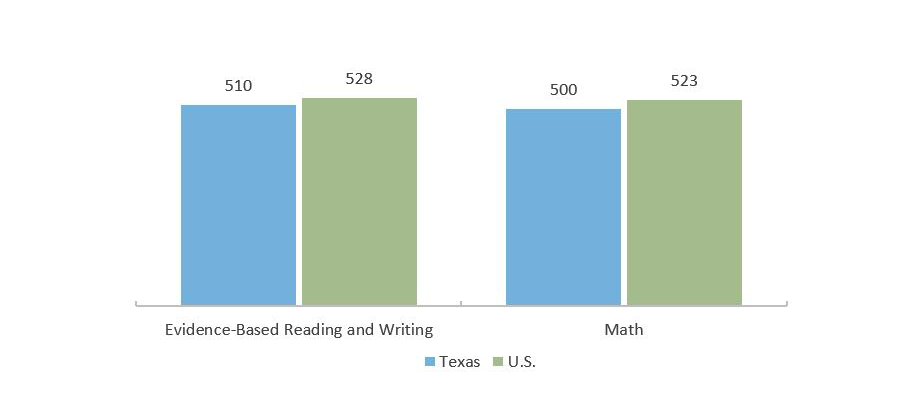
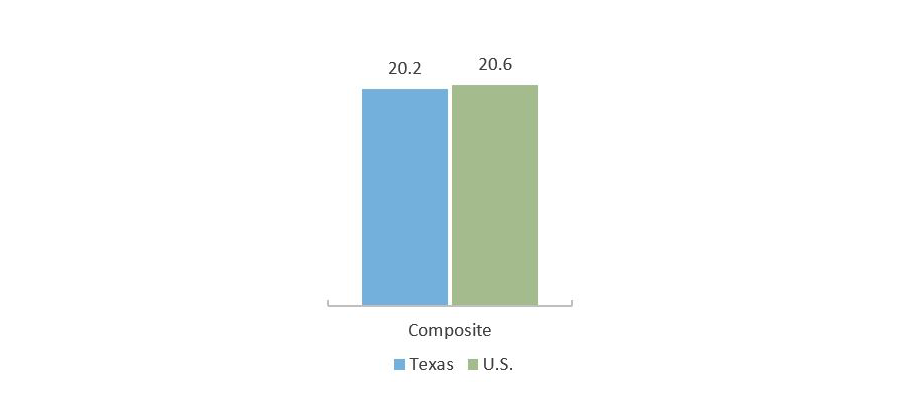
Texas College Prep Test Scores Keep Pace with, But Fail to Exceed, National Average
SAT Average Scores for 2020 High School Graduates
ACT Average Scores (2020)
Percent of ACT Test Takers Meeting the Benchmark, By Subject Area (2020)
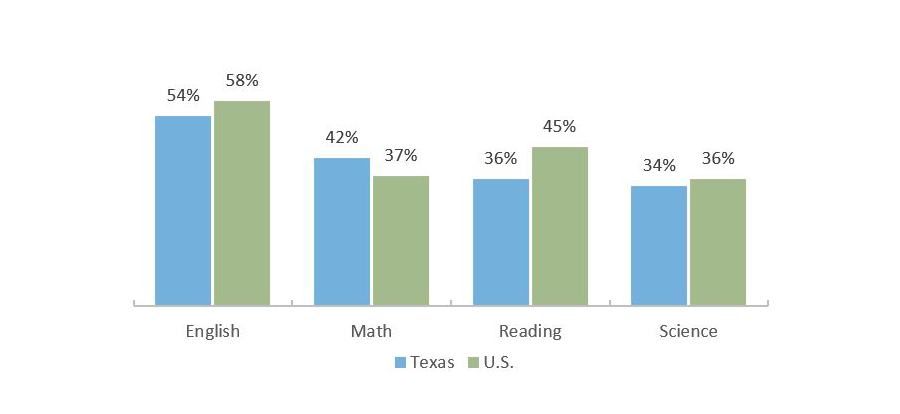
Source: SAT: The College Board, SAT Data & Reports, College-Bound Seniors 2020 (https://reports.collegeboard.org/pdf/2020-total-group-sat-suite-assessments-annual-report.pdf; https://reports.collegeboard.org/pdf/2020-texas-sat-suite-assessments-annual-report.pdf); ACT: ACT, National and State Scores 2020 (https://www.act.org/content/act/en/research/services-and-resources/data-and-visualization/grad-class-database.html).
Texas High School Students Less Prepared for College Academics
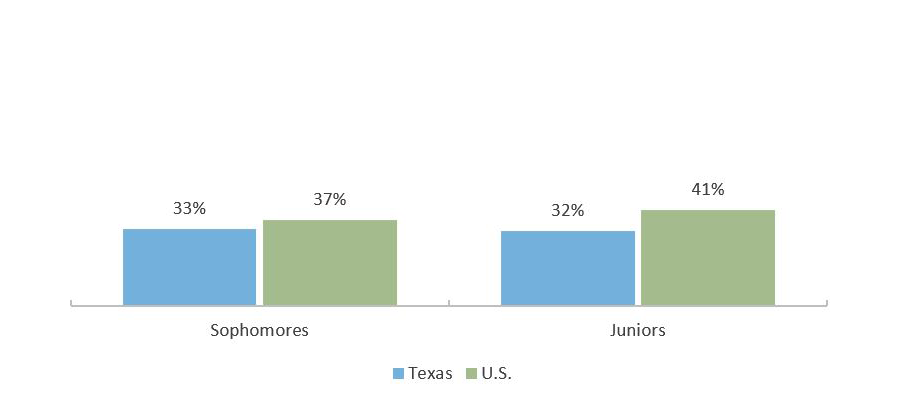
PSAT/NMSQT Test Takers Who Are on Track to be College Ready (2019-2020)
Percent of AP Test Takers who Scored at Least a 3 on at Least One AP Test (2000 – 2020)
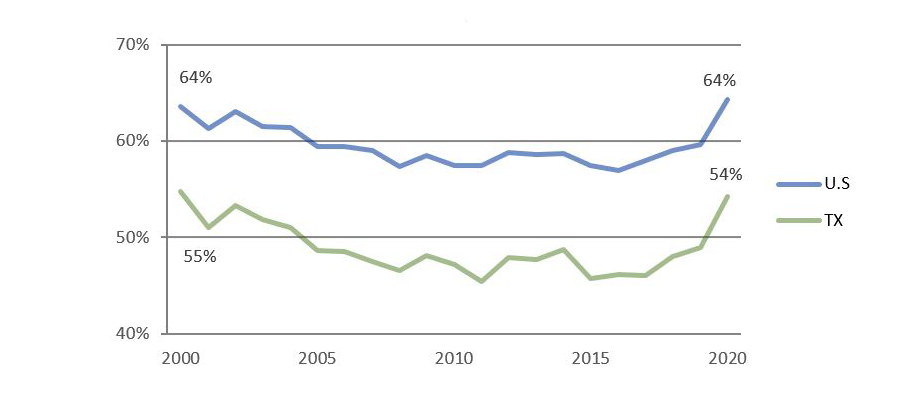
Source: PSAT/NMSQT: The College Board, PSAT/NMSQT Data & Reports (https://reports.collegeboard.org/pdf/2020-texas-sat-suite-assessments-annual-report.pdf; https://reports.collegeboard.org/pdf/2020-total-group-sat-suite-assessments-annual-report.pdf); AP: The College Board, AP Program and Participation Data 2020 (https://research.collegeboard.org/programs/ap/data/archived/ap-2019).
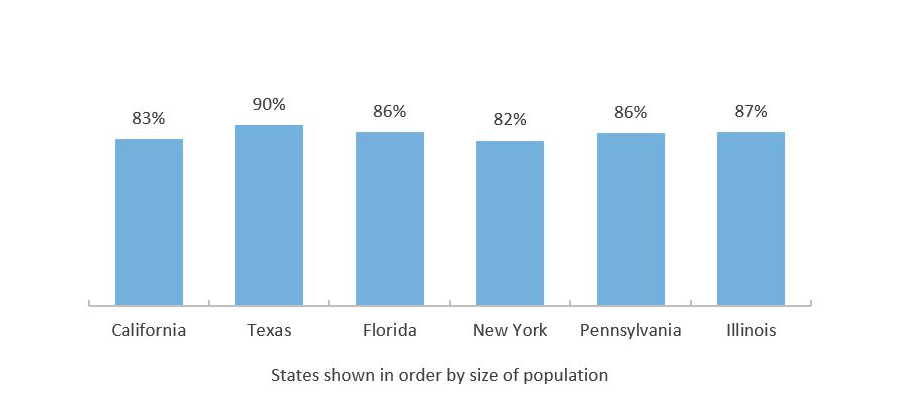
Texas Tops the Most Populous States in High School Graduation Rates
High School Graduation Rates (2017-2018)
High School Graduation Rates, by Race/Ethnicity (2017-2018)
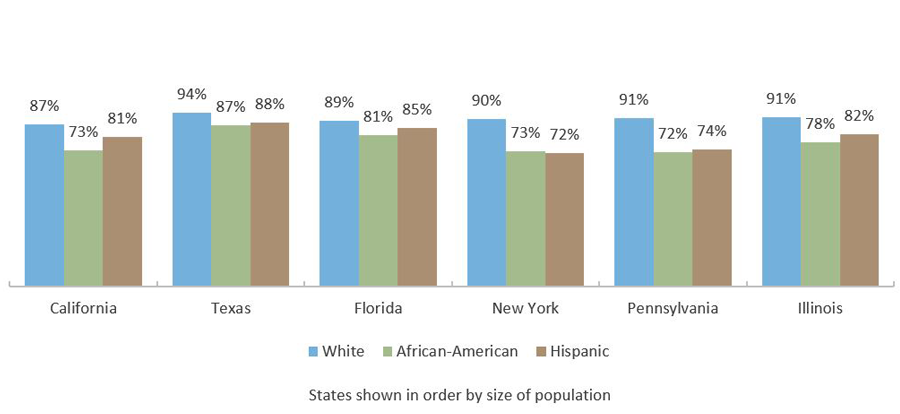
Source: Graduation Rates: U.S. Department of Education, ED Data Express, Data about elementary and secondary schools in the U.S. (https://eddataexpress.ed.gov/); All else: America’s Promise Alliance, 2017 Building a Grad Nation Report: Progress and Challenge in Raising High School Graduation Rates (http://gradnation.americaspromise.org/report/2017-building-grad-nation-report#driver-5-low-graduation-rate-high-schools).
Fifteen Percent of Texans Age 25 or Older Lack a High School Diploma
People Age 25 and Older Who Have Not Finished High School (2019)
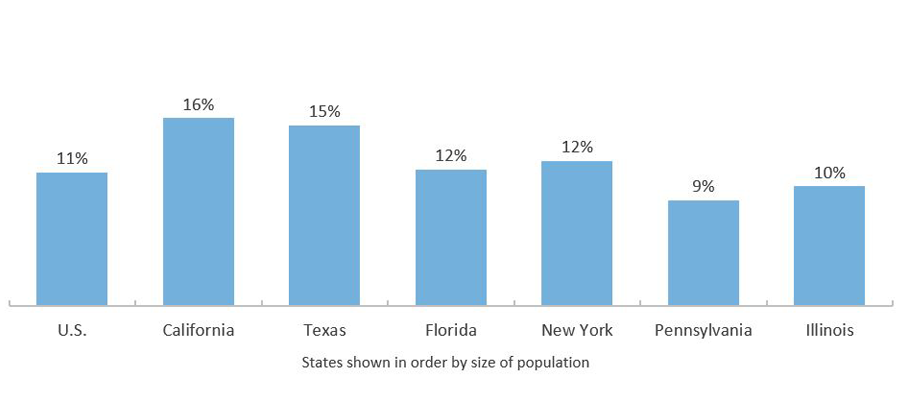
People Age 25 and Older Who Have Not Finished High School (2016)
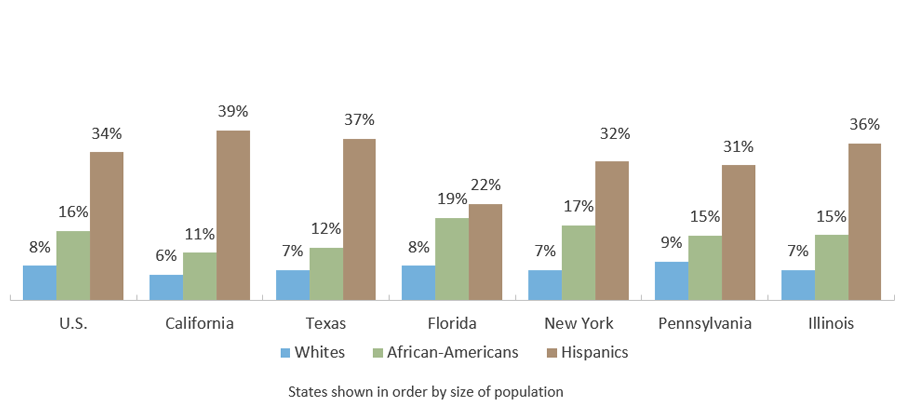
Source: Texas Demographic Center, Texas Population Projections Program, “Population Projections for the State of Texas and Counties in One File,” 2018 (https://demographics.texas.gov/Data/TPEPP/Projections/Index.aspx); High school completion among 25 and older: U.S. Census Bureau, 2019 American Community Survey 1-Year Estimates, Detailed Tables (http://www.census.gov/acs/www/); High school graduation rates: U.S. Department of Education, ED Data Express, Data about elementary and secondary schools in the U.S. (http://eddataexpress.ed.gov/).
Only Half of Texas High School Graduates Enroll in College Immediately after High School
Percentage of Texas High School Graduates Enrolling in College Immediately after Graduation*
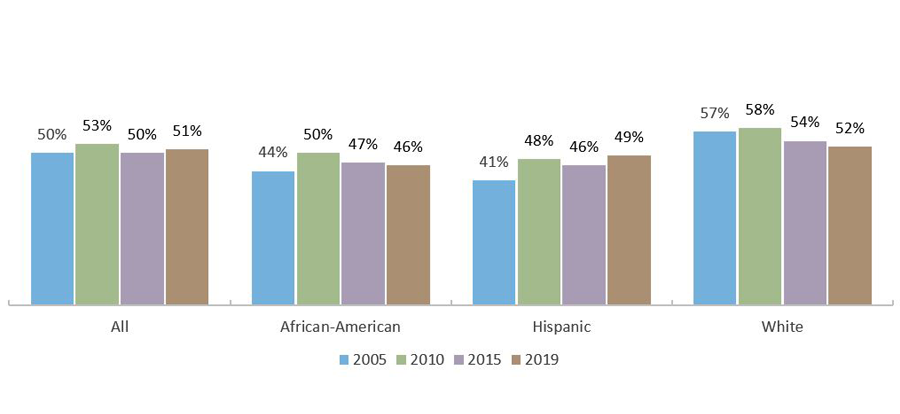
* Includes only Texas high school graduates who enrolled in a Texas public or private, nonprofit college or university. Data on students who enrolled at proprietary institutions or enrolled in out-of-state schools are not available. In AY 2007–2008, about 93 percent of Texas students who enrolled in college immediately after high school graduation were attending school in their state of residence.
Source: Texas Demographic Center, Texas Population Projections Program, “Population Projections for the State of Texas and Counties in One File,” 2018 (https://demographics.texas.gov/Data/TPEPP/Projections/Index.aspx); High school completion among 25 and older: U.S. Census Bureau, 2019 American Community Survey 1-Year Estimates, Detailed Tables (http://www.census.gov/acs/www/); High school graduation rates: U.S. Department of Education, ED Data Express, Data about elementary and secondary schools in the U.S. (http://eddataexpress.ed.gov/).
Low-Income Texas High School Graduates Are Less Likely to Directly Enroll in College
Percentage of 2018-2019 Texas High School Graduates Enrolled in Texas Higher Education in Fall 2019, by Ethnicity
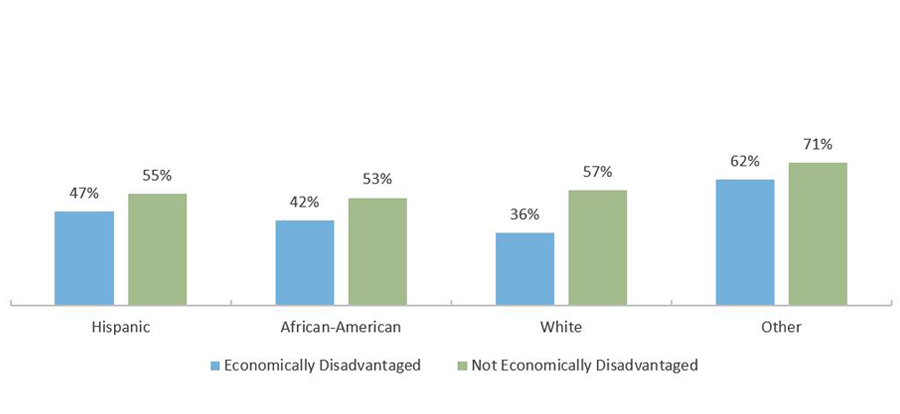
Number of 2018-2019 Texas High School Graduates, by Ethnicity
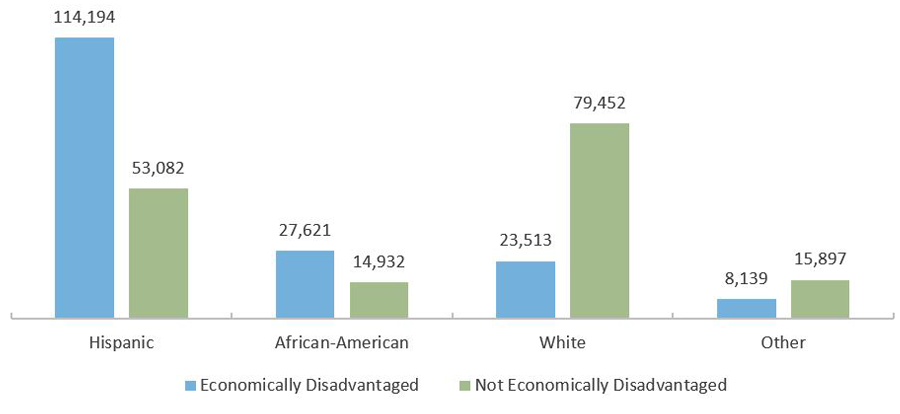
*The Texas Education Agency (TEA) collects data on whether a student is “economically disadvantaged” based on the student’s eligibility for free or reduced lunch as a proxy for family income. The TEA does not have detailed information about family income.
Source: The Texas Higher Education Coordinating Board, “2018-2019 High School Graduates Enrolled in Higher Education Fall 2019, by Diploma Type and Ethnicity” (unpublished tables).
Rio Grande Valley Has Highest FAFSA Completion Rates in Texas, East Texas the Lowest
Fall 2020 FAFSA Completion Rate by Region*
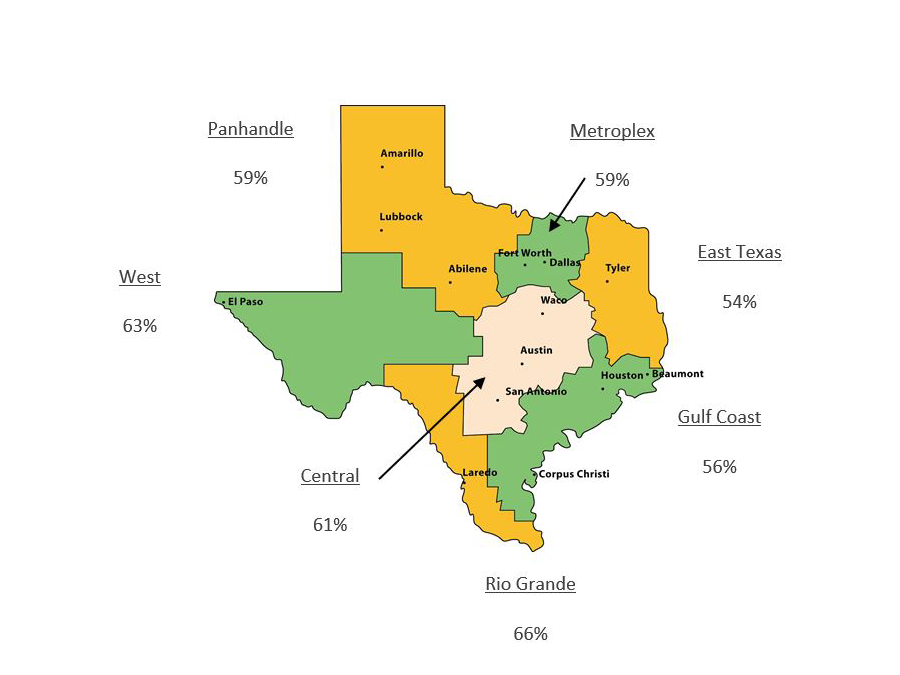
* Fall 2020 represents the class of 2019-2020 high school seniors completing the FAFSA as of September 25, 2020.
Source: U.S. Department of Education, Office of Federal Student Aid, FAFSA Completion by High School (http://studentaid.ed.gov/about/data-center/student/application-volume/fafsa-completion-high-school). Number of high school seniors from Texas Education Agency (special request); FAFSA Requirement for High School Seniors: Inside Higher Ed, Making the FAFSA Mandatory (July 10, 2019) (https://www.insidehighered.com/news/2019/07/10/texas-becomes-second-state-require-fafsa-completion); Rio Grande Valley FAFSA efforts: learned via communication with the Austin Chamber of Commerce.
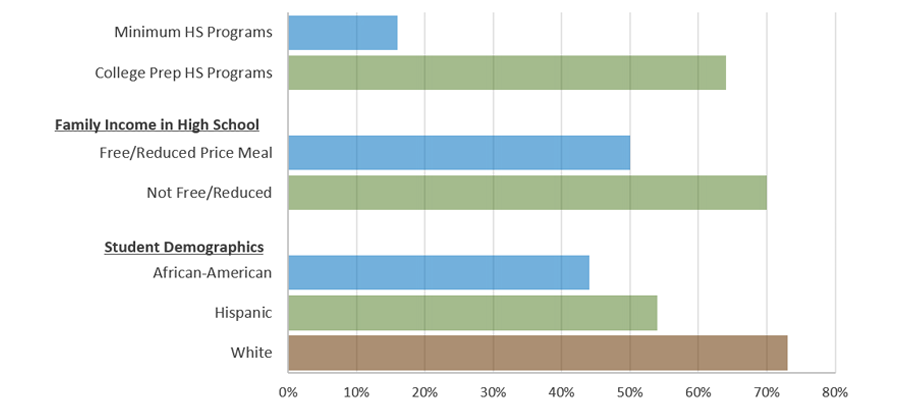
The Importance of College Prep Programs in High School
Percent of 2016-17 Texas High School Graduates, Enrolled in Texas Higher Education in Fall 2017 that Met All TSI Standards