State of Student Aid in Texas – 2021
Texas Undergraduates More Likely Than U.S. Undergraduates to Attend Two-Year Institutions
Undergraduate Enrollment by Location and Sector (Fall 2018)
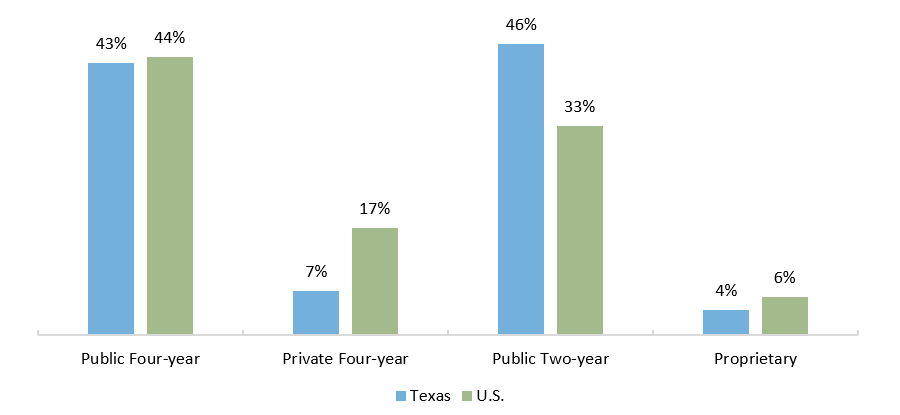
Source: U.S. Department of Education, National Center for Education Statistics, Integrated Postsecondary Education Data System (IPEDS) 2018 (http://nces.ed.gov/ipeds/).
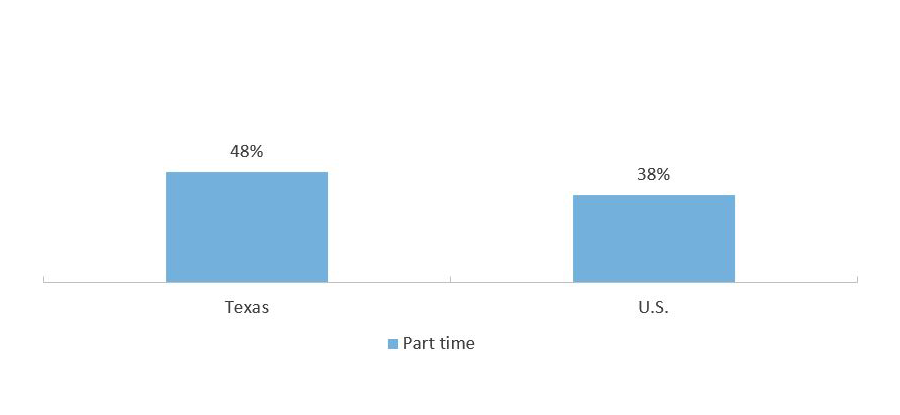
Nearly Half of Undergraduates in Texas Enroll in School Part Time
Enrollment Intensity of Undergraduates in Texas and the U.S. (Fall 2018)
Enrollment Intensity of Undergraduates in Texas by School Sector (Fall 2018)
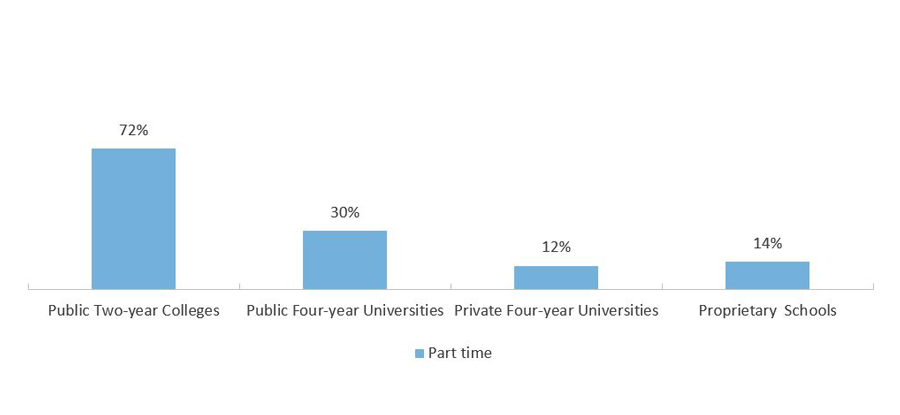
Note: Institutions report their enrollment data to the Department of Education. The data are compiled but not de-duplicated at a student level, therefore some students may be concurrently enrolled at multiple institutions which may increase the proportion of students enrolled part-time.
Source: U.S. Department of Education, National Center for Education Statistics, Integrated Postsecondary Education Data System (IPEDS) 2018 (http://nces.ed.gov/ipeds/).
Most First-Year Undergraduates in Texas Attend Two-Year Institutions
Texas Undergraduates by Race/Ethnicity and Sector (Fall 2018)
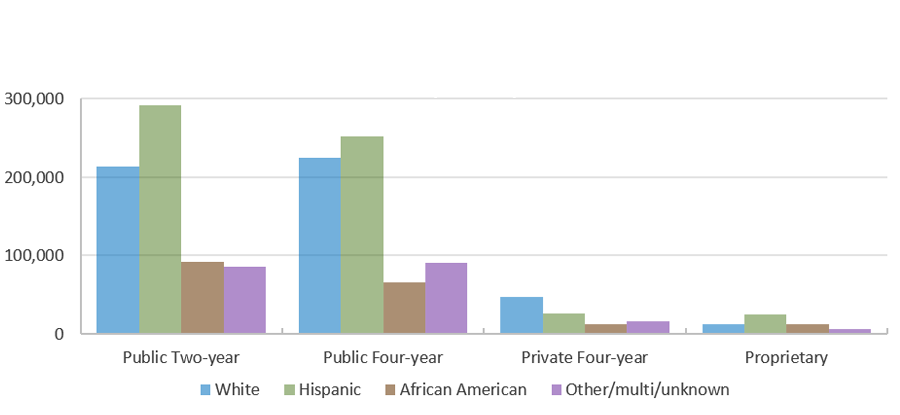
Undergraduates by Classification and Sector (Fall 2018)
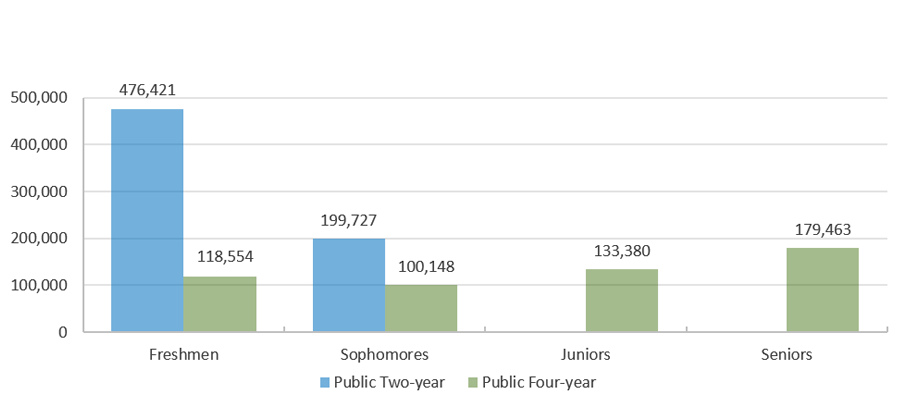
Source: Enrollment by classification: Texas Higher Education Coordinating Board (THECB), Texas Higher Education Data, Accountability System Interactive Reports, Enrollment Statewide by Institution Type and Classification (http://www.txhigheredaccountability.org/AcctPublic/InteractiveReport/Accountability). Enrollment by race (fall 2018): U.S. Department of Education, National Center for Education Statistics, Integrated Postsecondary Education Data System (IPEDS) 2018 (http://nces.ed.gov/ipeds/).
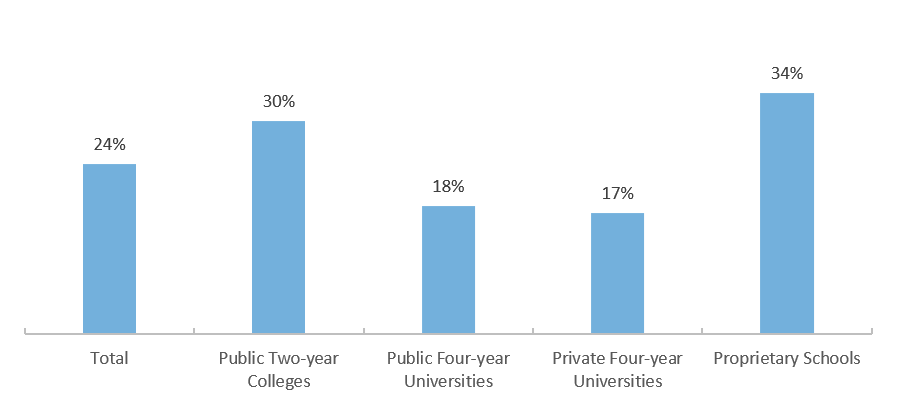
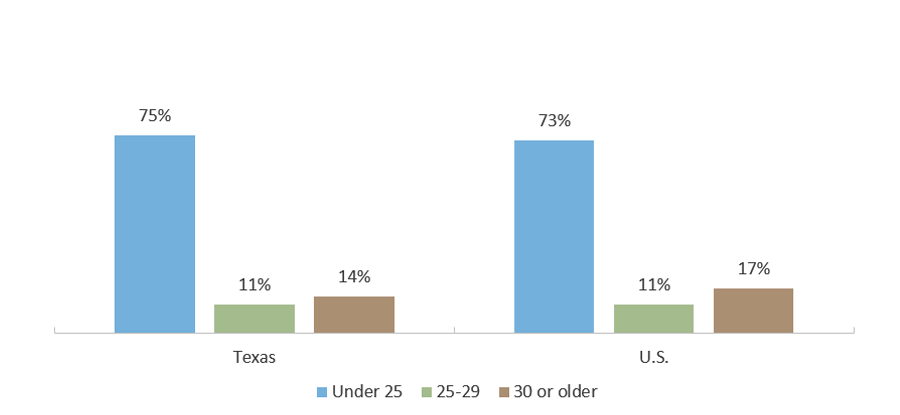
Older Students Gravitate to Community Colleges and Proprietary Schools
Age of Undergraduates in Texas and the U.S. (Fall 2017)
Age of Undergraduates in Texas by School Sector (Fall 2017)
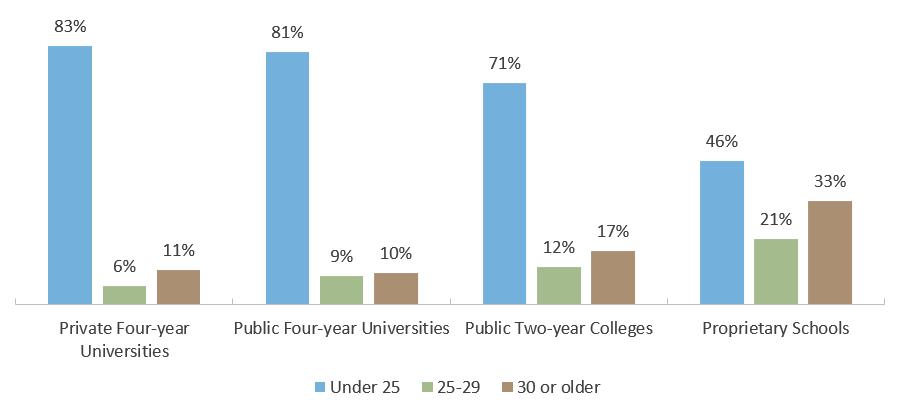
Source: U.S. Department of Education, National Center for Education Statistics, Integrated Postsecondary Education Data System (IPEDS) 2017 (http://nces.ed.gov/ipeds/).
Greater Percentages of Postsecondary Students Live Below the Poverty Line and Require More Financial Aid
U.S. Postsecondary Students by Income as Percent of Poverty Line, 2000-2016
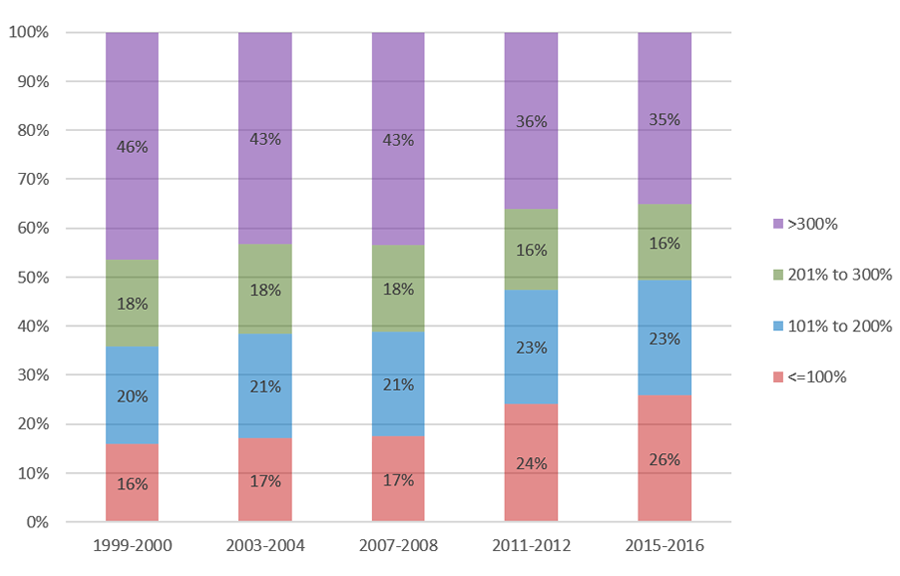
Source: U.S. Department of Education, National Postsecondary Student Aid Study (NPSAS) (http://www.nces.ed.gov/das), survey years 2000, 2004, 2008, 2012, and 2016.
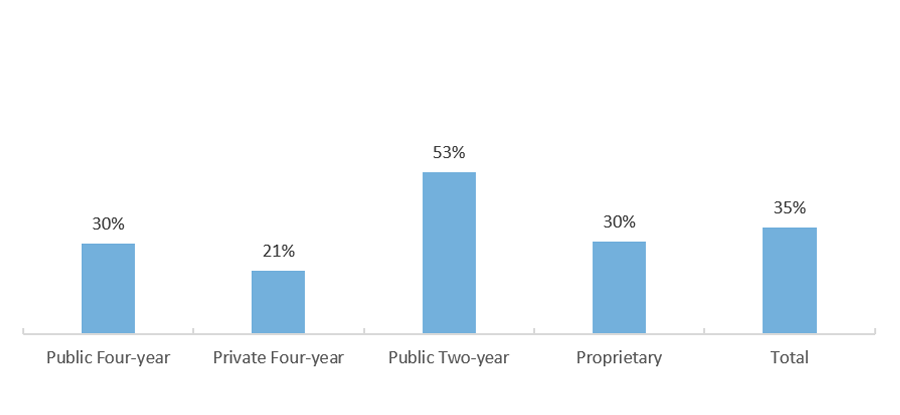
Over Half of Community College Students in the U.S. Had Taken Developmental Education Courses During College
Percentage of U.S. Students Who Ever Took Developmental Education Courses, by Sector (AY 2015-2016)
Percentage of U.S. Students Who Ever Took Developmental Education Courses, by Attendance Intensity (AY 2015-2016)
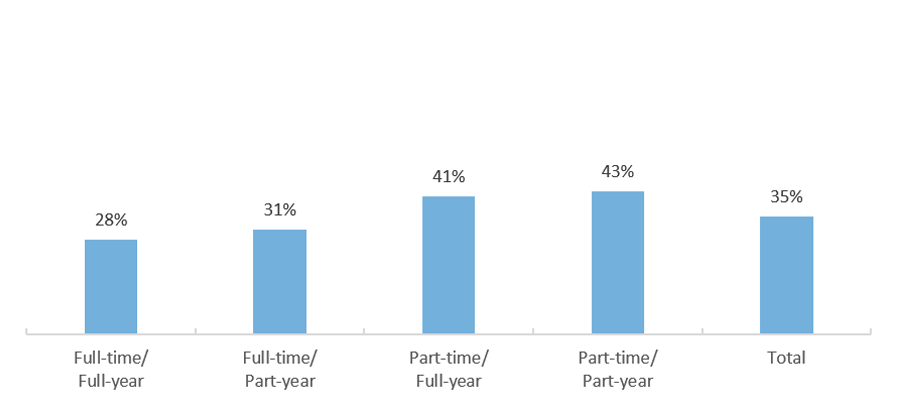
Source: U.S. Department of Education, National Postsecondary Student Aid Study 2016 (NPSAS) (http://www.nces.ed.gov/das); Graduation Rate: Texas Higher Education Coordinating Board (THECB), Graduation and Persistence of Developmental Education Students (http://www.txhighereddata.org/index.cfm?objectId=200A40A0-E156-11E8-BB650050560100A9).
Seventy-Four Percent of Students at Texas Public Universities Were Not in the Top 10 Percent of Their High School Class
Percentage of Top 10 Percent Admits Among First-Time Texas Public Four-Year University Students (Fall 2017)
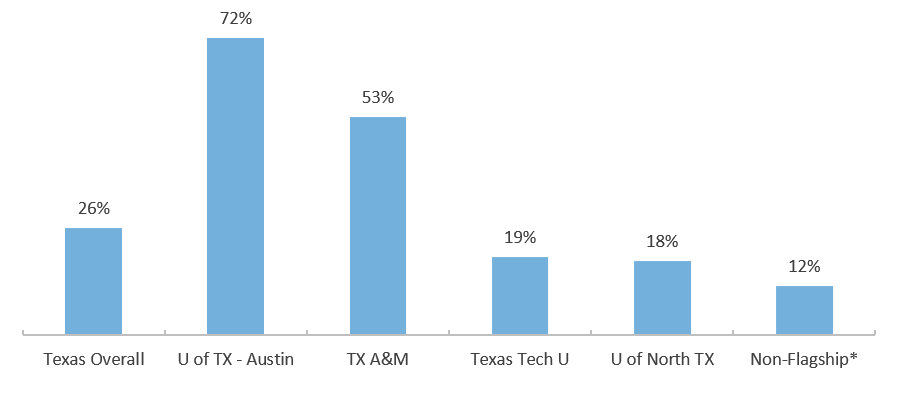
*Estimate based on applying the percentage of top ten percent graduates among first-time students to the number of enrolled freshmen-level students.
**This is the number of non-flagship public universities for which the THECB had data on the percentage of top 10 percent enrollments. There are 37 Texas public universities in total.
Source: Texas Higher Education Coordinating Board (THECB) 2018 Higher Education Almanac Institutional Comparison Sheets (http://www.thecb.state.tx.us/index.cfm?objectid=629F37F0-861F-11E8-AE230050560100A9).
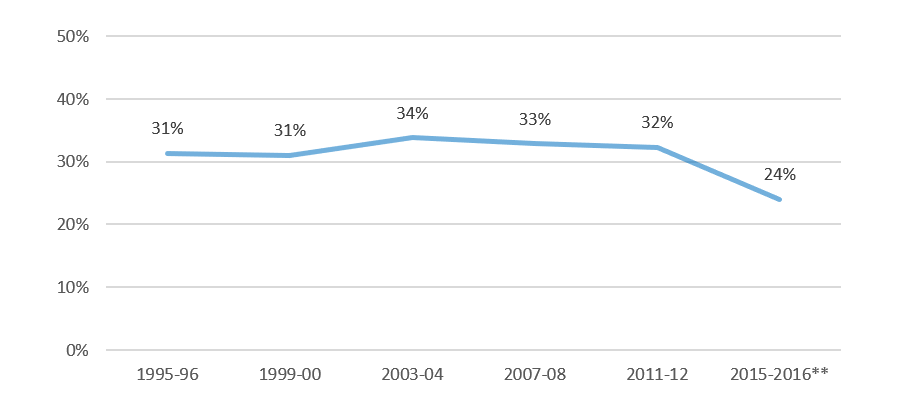
First-Generation Students’ Proportion of Undergraduate Enrollments Declining
Percent of U.S. Undergraduate Enrollment that is First Generation,* Nationally by Year
Percent of U.S. Undergraduate Enrollment that is First Generation,* Nationally by School Type for Academic Year 2015-16