State of Student Aid in Texas – 2021
The Federal Pell Grant is the Largest Source of Grant Aid in Texas
Total Grant Aid Awarded in Texas by Major Grant Program, FY2018-2019*
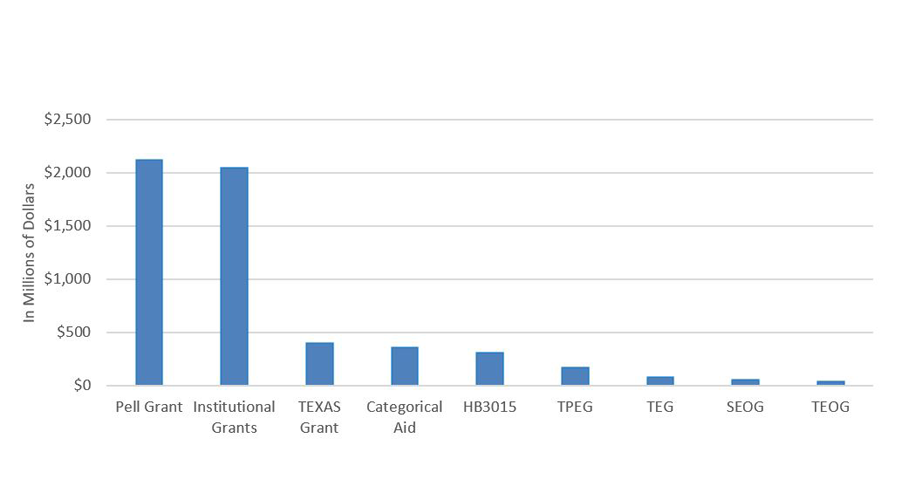
*Amounts for state aid programs are reported by fiscal year, whereas Pell and SEOG are reported by award year (see Glossary)
Sources: Aid in Texas: Texas Higher Education Coordinating Board, Report on Student Financial Aid in Texas Higher Education, Fiscal Year 2019 (http://reportcenter.thecb.state.tx.us/reports/data/report-on-student-financial-aid-in-texas-higher-education-for-fy-2018/).
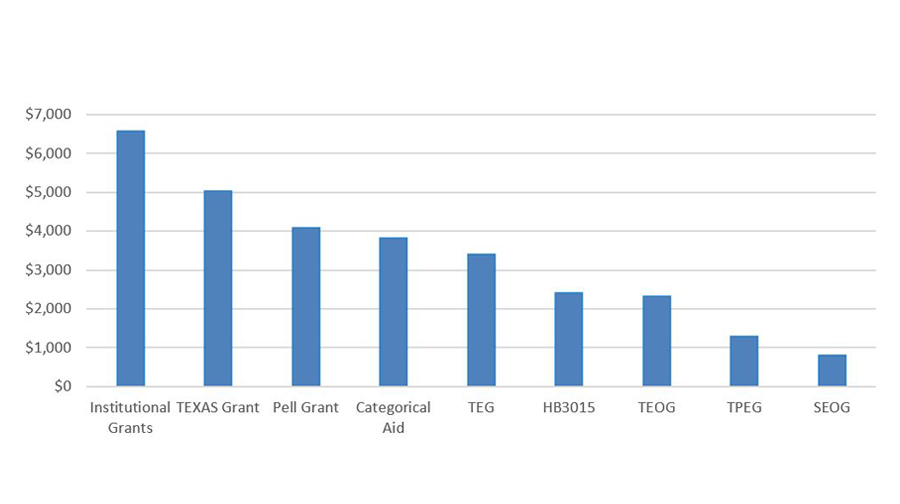
Institutional Grants Have Highest Average Award
Average Grant Award in Texas by Major Grant Program, FY2018-2019
Sources: Aid in Texas: Texas Higher Education Coordinating Board, Report on Student Financial Aid in Texas Higher Education, Fiscal Year 2019 (http://reportcenter.thecb.state.tx.us/reports/data/report-on-student-financial-aid-in-texas-higher-education-for-fy-2018/).
Grant Recipients in Texas Are Racially/Ethnically Diverse
Fall 2018 Enrollment in Texas Higher Education, by Ethnicity
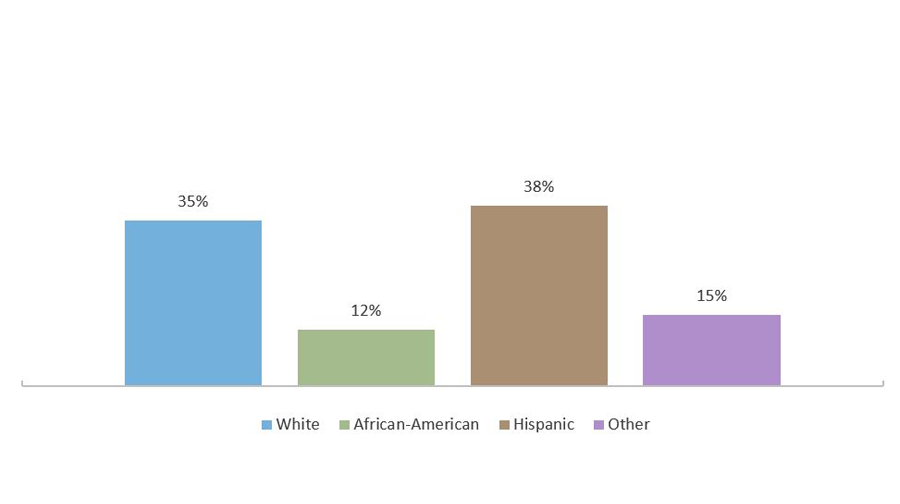
Fiscal Year 2018-2019 Grant Program Recipients by Ethnicity
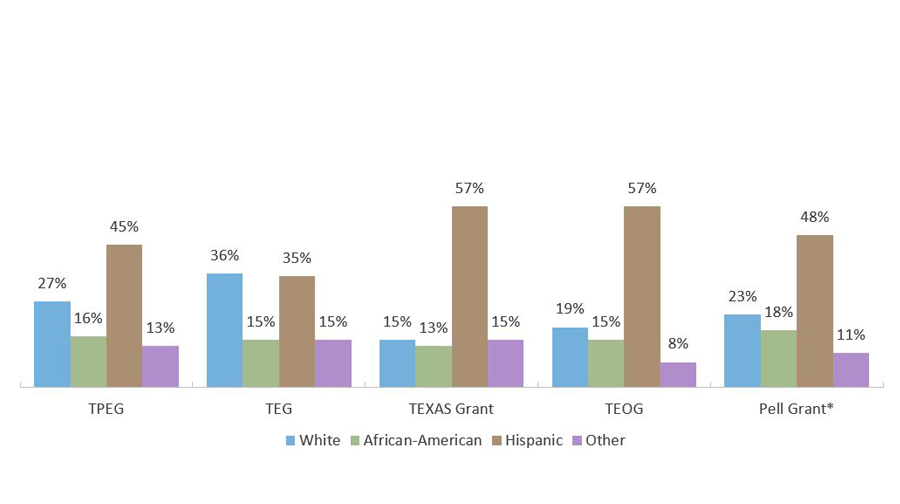
*Pell grant data did not disaggregate “Asian/Pacific Islander” from “Other”, so both are included in “Other”.
Sources: Enrollment by ethnicity: U.S. Dept of Education, National Center for Education Statistics, IPEDS (https://nces.ed.gov/ipeds/); Texas grant programs: THECB Financial Aid Database for Fiscal Year 2019 (special request, unpublished tables).
The Federal Pell Grant Covers Less Than One-Fifth of Average Public Four-Year Costs
Total Cost of Attendance for Two Semesters Full-time Attendance at Texas Public Institutions Covered by Average Pell Grant Amount, by Sector (AY 2018-2019)
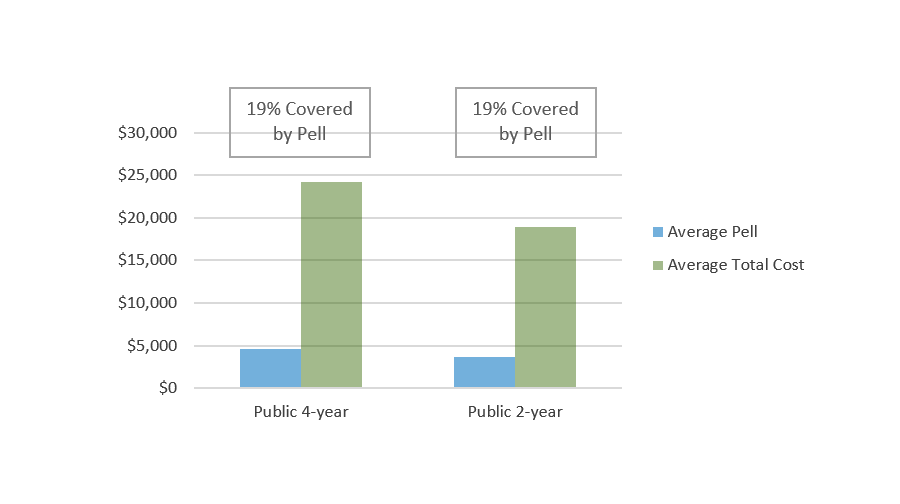
Sources: Cost of attendance: U.S. Department of Education, National Center for Education Statistics, IPEDS Data Center (Author’s calculation: Total cost of full-time undergraduate attendance weighted by FTE in-state undergraduate enrollment) (http://nces.ed.gov/ipeds/datacenter/); Pell: U.S. Department of Education, Federal Student Aid Data Center, Programmatic Volume Reports (http://studentaid.ed.gov/about/data-center/student/title-iv); Maximum Pell: U.S. Department of Education, Federal Student Aid (https://studentaid.ed.gov/sa/types/grants-scholarships/pell).
California, New York, and Florida Top Texas in State Grants
Total State Grant Aid (millions of current dollars)
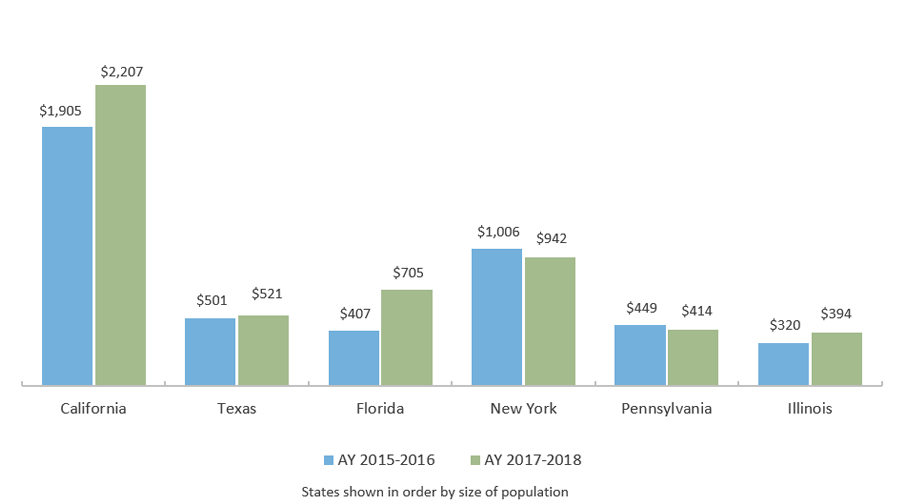
Sources: TEXAS Grant Eligibility: College For All Texans, http://www.collegeforalltexans.com/apps/financialaid/tofa2.cfm?ID=458; All other: National Association of State Student Grant and Aid Programs. 49th Annual Survey Report on State-Sponsored Student Financial Aid. 2018 (https://www.nassgapsurvey.com/).
U.S. Undergraduate Veterans Received About $12,000 in Median Total Veterans’ Education Benefits
Median Total U.S. Veterans’ Education Benefits in AY 2015-2016
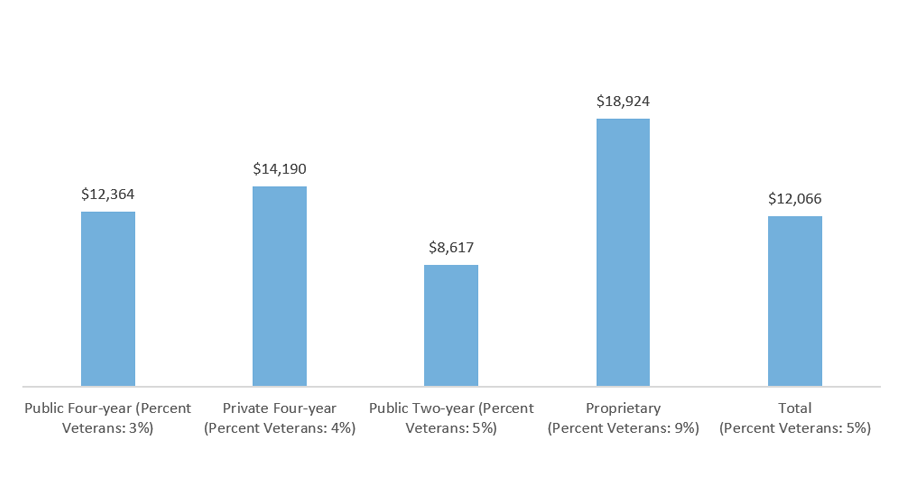
*Institutional benefits include the institutional portion of the Yellow Ribbon program benefits. Federal benefits include Department of Defense military tuition grants and include payments made for tuition and fees, housing, books and supplies, work-study, and other educational expenses (as reported by the Veterans Benefits Administration).
Sources: U.S. Department of Education, National Postsecondary Student Aid Study (NPSAS) 2016 (http://www.nces.ed.gov/das).
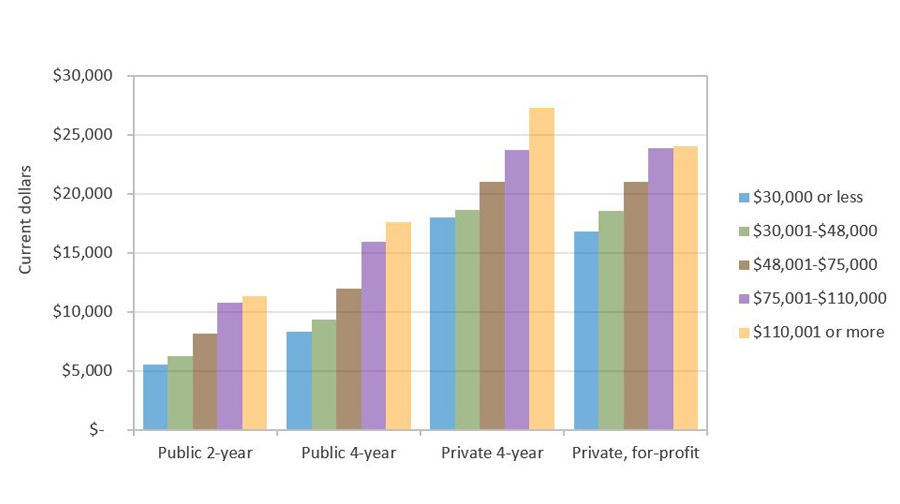
Net Price of Attendance for Lowest-Income Public Four-Year Undergraduates in Texas Is More Than $8,000
Average Net Price for Full-time, First-time Undergraduates in Texas by Sector and Income Quintile (AY 2018-2019)