State of Student Aid in Texas – 2022
Section 11: Consumer Debt
- Total U.S. Consumer Debt Reaches $15.6 Trillion, Student Loan Debt $1.6 Trillion
- Unlike the Nation, Texas Student Debt per Capita has not Surpassed Auto Debt
- Texas Student Loan Balance Per Capita Lower Than National Average
- The Nation Sees Decreases in Severely Delinquent Balances as the CARES Act Offers Some Relief During Pandemic
- Severe Delinquency for Student Loan Borrowers Has Fallen Dramatically Since 2020
- Delinquent Balances for Student Loan Debt Continue to Decrease Due to COVID-19 Pandemic Relief Measures
- New Index Rates Universities Based on Economic Mobility of Students
- Texas Students Who Leave Without a Degree Have Lower Earnings Than Those Who Obtained a Degree
- More than Three-quarters of Texas Higher Education Graduates Are Working or Enrolled Within One Year of Receiving Degree
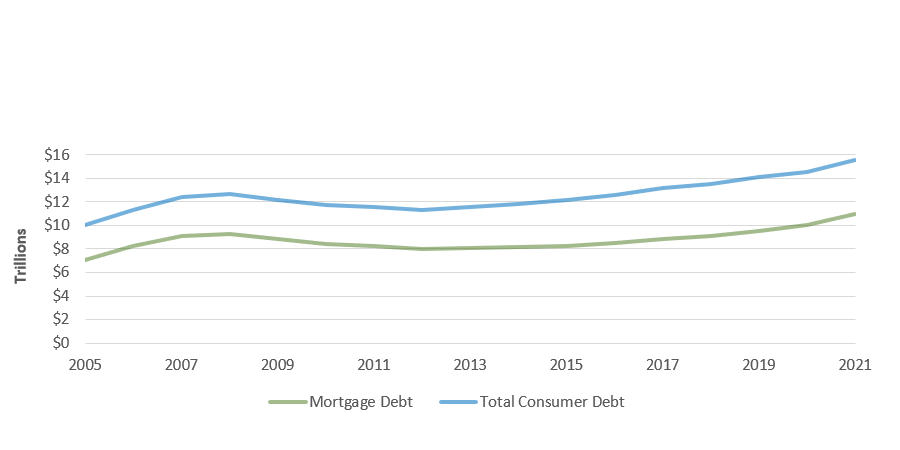
Total U.S. Consumer Debt Reaches $15.6 Trillion, Student Loan Debt $1.6 Trillion
Total U.S. Consumer Debt Balance and Mortgage Debt Balance in Trillions of Dollars, Over Time, 2005-2021
U.S. Consumer Debt Balances in Trillions of Dollars (Non-Mortgage), Over Time, 2005-2021
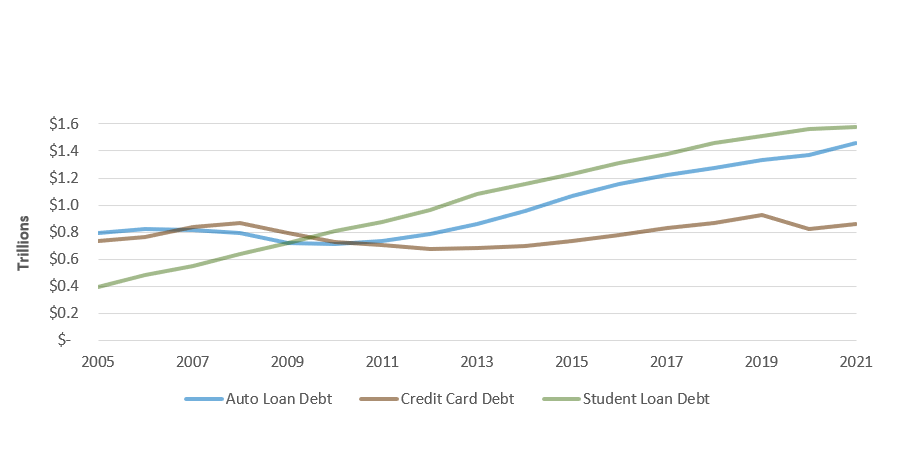
Sources: Federal Reserve Bank of New York, The Center for Microeconomic Data, Data & Reports, 2021 Q4 (https://www.newyorkfed.org/microeconomics/data.html).
Unlike the Nation, Texas Student Debt per Capita has not Surpassed Auto Debt
U.S. Non-Mortgage Consumer Debt per Capita, 2005-2021
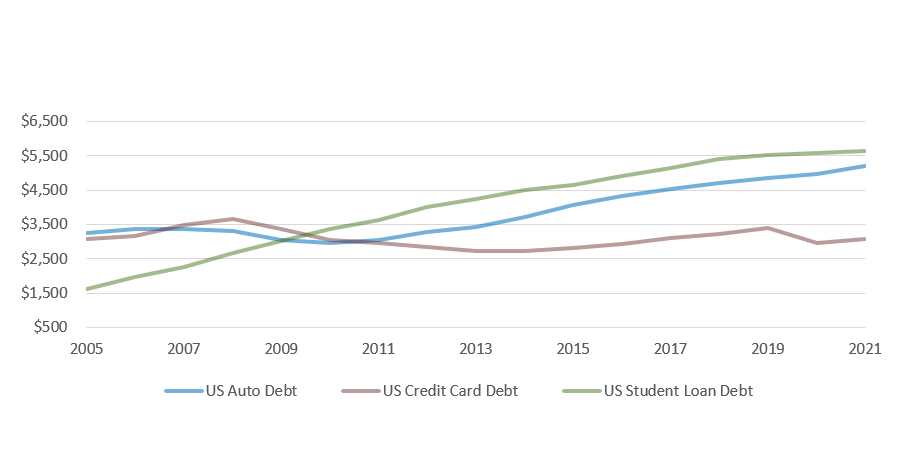
Texas Non-Mortgage Consumer Debt per Capita, 2005-2021
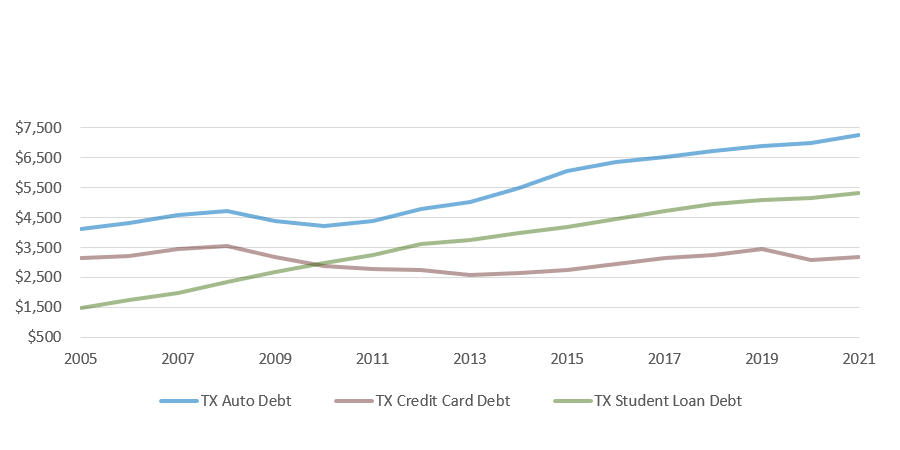
Sources: Federal Reserve Bank of New York, The Center for Microeconomic Data, Data & Reports, 2021 Q4 (https://www.newyorkfed.org/microeconomics/data.html).
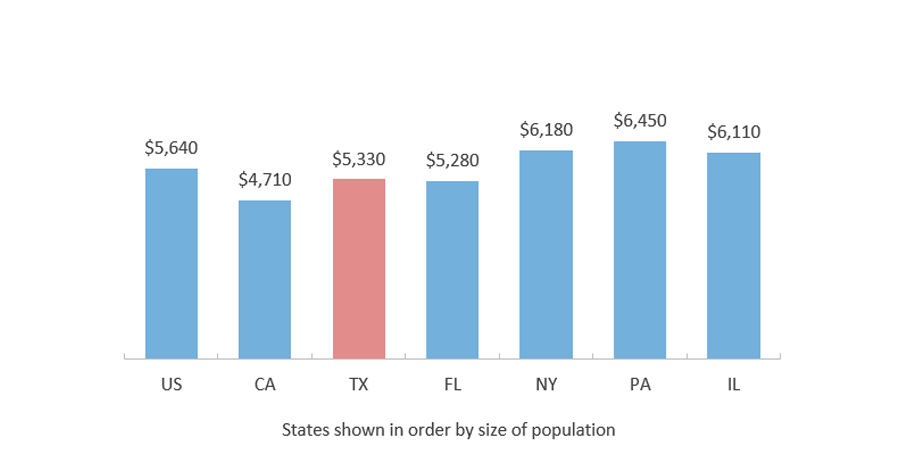
Texas Student Loan Balance Per Capita Lower Than National Average
Student Loan Debt Balance per Capita by State, 2021 Q4
Total Debt Balance per Capita by State, 2021 Q4
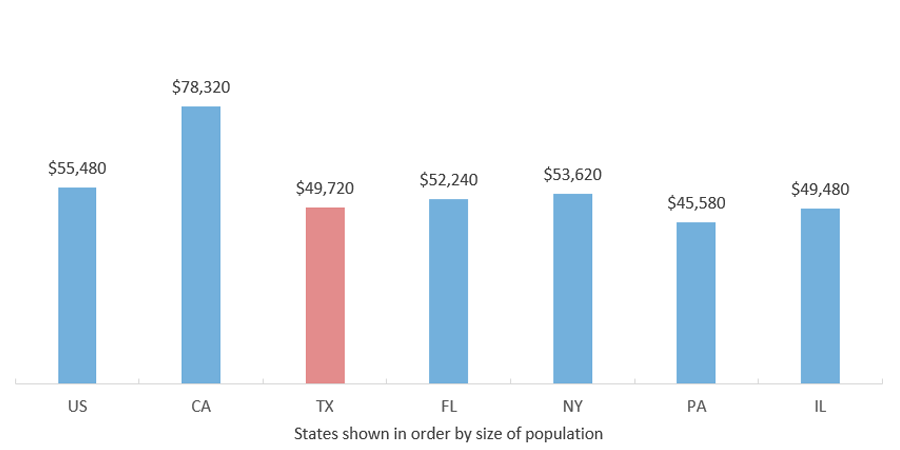
Sources: Federal Reserve Bank of New York, The Center for Microeconomic Data, Data & Reports, 2021 Q4 (https://www.newyorkfed.org/microeconomics/data.html).
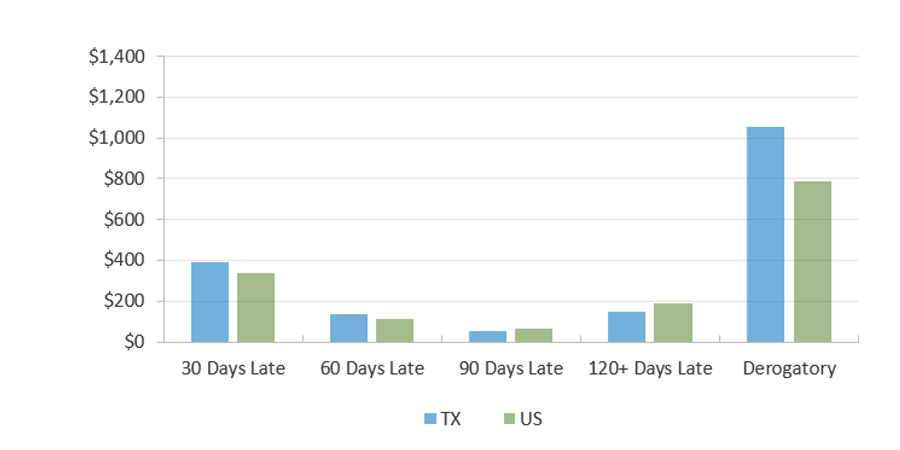
The Nation Sees Decreases in Severely Delinquent Balances as the CARES Act Offers Some Relief During Pandemic
Delinquency Status of Debt per Capita by State, 2022 Q1
Percentage of Balance 90+ Days Late by State, 2021 and 2022
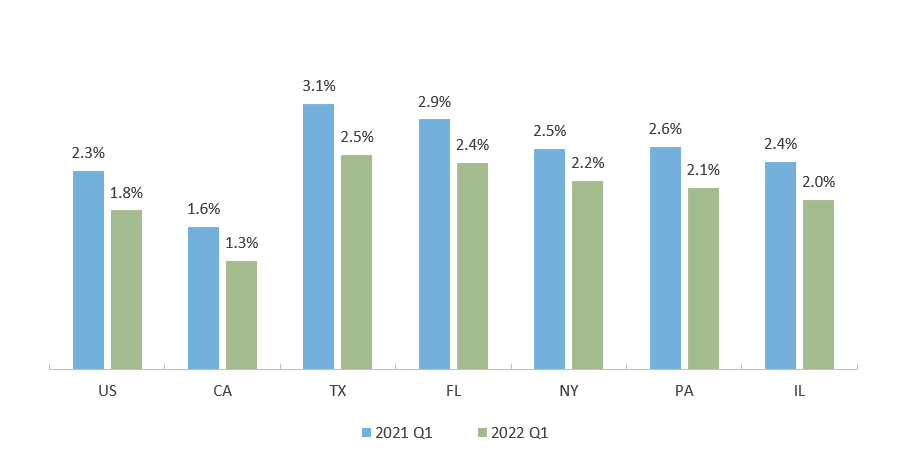
Note: The Derogatory delinquency status includes a person with any level of delinquency combined with repossession, charge off to bad debt, or foreclosure.
Sources: Federal Reserve Bank of New York, The Center for Microeconomic Data, Data & Reports, 2022 Q1 (https://www.newyorkfed.org/microeconomics/data.html).
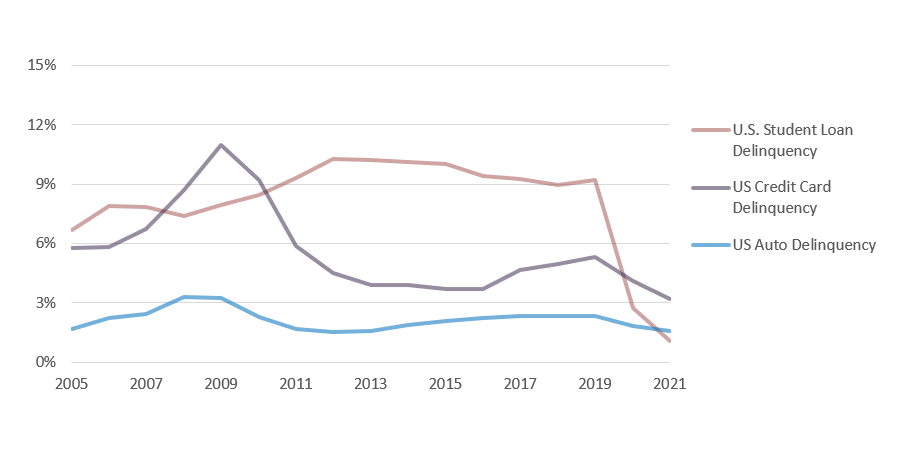
Severe Delinquency for Student Loan Borrowers Has Fallen Dramatically Since 2020
Percent of U.S. Consumer Debt Balance That is 90+ Days Delinquent, Over Time, 2005-2021
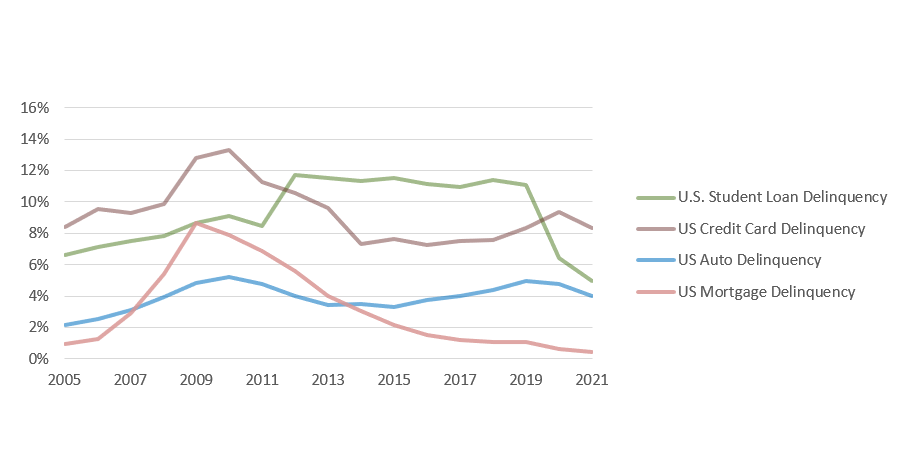
Sources: Federal Reserve Bank of New York, The Center for Microeconomic Data, Data & Reports, 2021 Q4 (https://www.newyorkfed.org/microeconomics/data.html).
Delinquent Balances for Student Loan Debt Continue to Decrease Due to COVID-19 Pandemic Relief Measures
New 90+ Days Delinquent Loan Balances in Billions of Dollars (Non-Mortgage), Over Time, 2005-2021
Sources: Federal Reserve Bank of New York, The Center for Microeconomic Data, Data & Reports, 2021 Q4 (https://www.newyorkfed.org/microeconomics/data.html).
New Index Rates Universities Based on Economic Mobility of Students
Economic Mobility Index for Texas Universities
| Tier 1 (30 schools) |
Tier 2 (12 schools) |
Tier 3 (7 schools) |
Tier 4 (11 schools) |
Tier 5 (5 schools) |
|
|---|---|---|---|---|---|
| Average Annual Federal Student Aid Received | $105 million | $83 million | $24 million | $54 million | $17 million |
| Price-to-Earnings Premium | 2.3 years | 3.5 years | 4.1 years | 6.3 years | 14.9 years |
| Median Net Cost to Earn Credential for Low-Income Students | $39,917 | $60,322 | $64,879 | $86,456 | $80,314 |
| Earnings Beyond High School Graduate for Low-Income Students | $17,934 | $21,424 | $25,367 | $18,424 | $7,184 |
Sources: Third Way, A New Way of Rating Institutions of Higher Ed: Upgrading the Economic Mobility Index, July 21, 2022 (https://www.thirdway.org/blog/a-new-way-of-rating-institutions-of-higher-ed-upgrading-the-economic-mobility-index).
Texas Students Who Leave Without a Degree Have Lower Earnings Than Those Who Obtained a Degree
Median Annual Earnings* For Those Employed from the 2018-2019 Exit Cohort at Texas Community and Technical Colleges
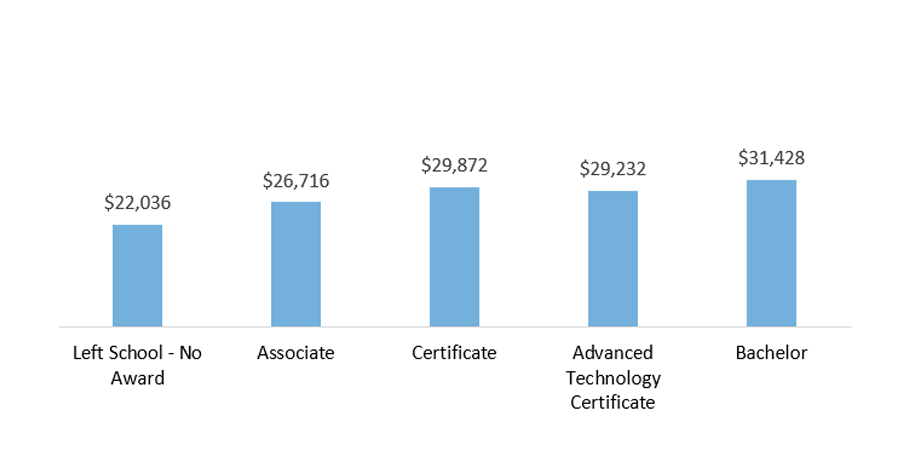
Median Annual Earnings* for Those Employed from the 2018-2019 Exit Cohort at Texas Universities
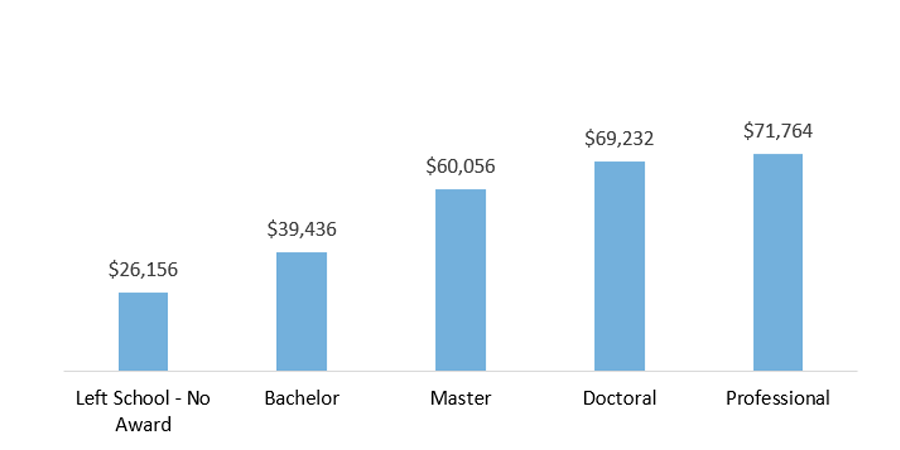
* Earnings data in the THECB Exit Cohort Reports is quarterly. The data are annualized for these charts by multiplying the quarterly data by four.
Sources: Texas Higher Education Coordinating Board, Exit Cohort Reports (http://www.txhighereddata.org/index.cfm?objectid=7F22CE00-E218-11E8-BB650050560100A9).
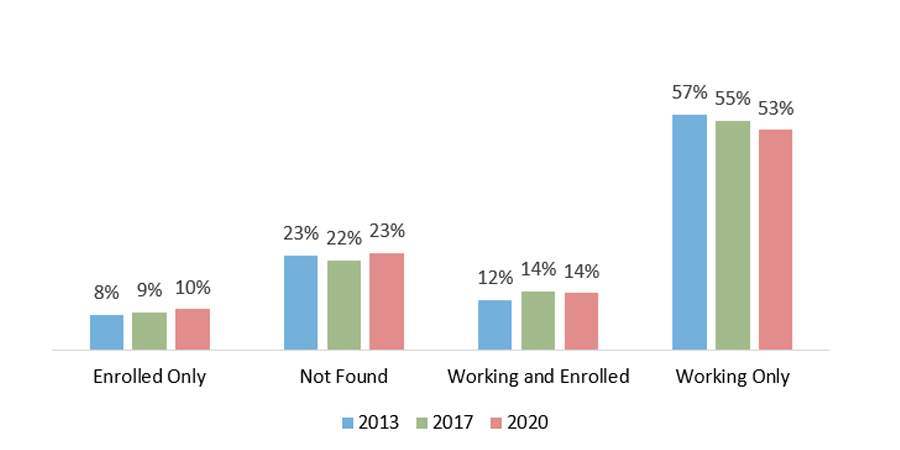
More than Three-quarters of Texas Higher Education Graduates Are Working or Enrolled Within One Year of Receiving Degree
Percentage of Students Working or Enrolled Within One Year After Award