State of Student Aid in Texas – 2022
Section 4: Cost of Education and Sources of Aid in Texas
- Texas Public Four-Year University Cost of Attendance Nearly Level with National Average
- Texas Public Two-Year Colleges Cost Catching up to National Average
- Costs at Texas Private Four-Year Universities Now Higher Than National Average
- The Cost of Going to College Continues to Rise Each Year
- Living Situation Key to Staying Within Average Room and Board Budgets at Texas Public Universities
- Average Tuition at Texas Public Four-Year Institutions Has Increased by 26 Percent Since 2008, Lower Than for the U.S.
- Nearly Two-Thirds of Student Aid Comes from the Federal Government
- Nearly Half of Aid is in the Form of Loans
- Texas Public Institution Students Are Most Heavily Dependent on Federal Student Aid
- Students at Public Institutions in Texas Benefited from $842 Million in Exemptions and Waivers
- States Have Increased Support for Higher Education Over the Past Five Years
- Community College Total Tax Revenue Saw Recent Declines
- Public Educational Appropriations Decreased in Texas Over the Last Ten Years
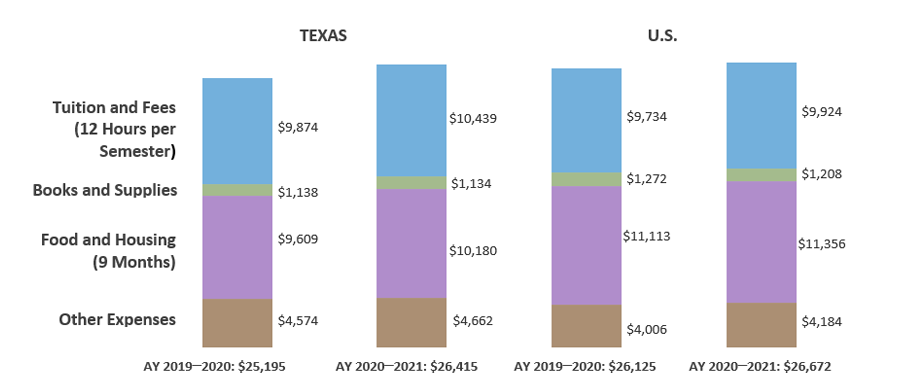
Texas Public Four-Year University Cost of Attendance Nearly Level with National Average
Weighted Average Public Four-year University Cost of Attendance for Two Semesters for Full-time Undergraduates Living Off Campus in Texas and the U.S. (AY 2019–2020 and AY 2020–2021)
* An institution’s costs are multiplied by its enrollment. The sum of costs for all schools is then divided by full-time, undergraduate enrollment, such that schools with higher enrollments are given greater weight. See glossary for clarification.
** 12 semester hours or more.
*** Expected Family Contribution is now known as the Student Aid Index. It is an index number that colleges use to determine a family’s eligibility for financial aid. The number is determined through a federal formula that considers family income and size as well as the number of children in college, among other factors. The average amount that families actually contribute to educational expenses is unknown.
Sources: All Costs and Enrollments for 2020–2021: U.S. Department of Education, National Center for Education Statistics, Integrated Postsecondary Education Data System (IPEDS) 2020 (http://nces.ed.gov/ipeds/); All Costs and Enrollments for 2019–2020: U.S. Department of Education, National Center for Education Statistics, Integrated Postsecondary Education Data System (IPEDS) 2019 (http://nces.ed.gov/ipeds/); All other: U.S. Department of Education, National Postsecondary Student Aid Study – Administrative Collection (NPSAS-AC) 2018 (http://www.nces.ed.gov/das).
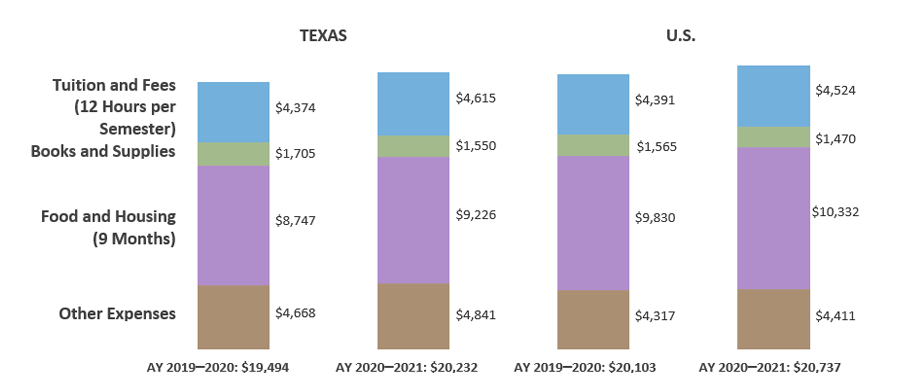
Texas Public Two-Year Colleges Cost Catching up to National Average
Weighted Average Public Two-year College Cost of Attendance for Two Semesters for Full-time Undergraduates Living Off Campus in Texas and the U.S. (AY 2019–2020 and AY 2020–2021)
without completing their program of study.
* 12 semester hours or more.
** An institution’s costs are multiplied by its enrollment. The sum of costs for all schools is then divided by full-time, undergraduate enrollment, such that schools with higher enrollments are given greater weight. See glossary for clarification.
*** Expected Family Contribution is now known as the Student Aid Index. It is an index number that colleges use to determine a family’s eligibility for financial aid. The number is determined through a federal formula that considers family income and size as well as the number of children in college, among other factors. The average amount that families actually contribute to educational expenses is unknown.
Sources: All Costs and Enrollments for 2020–2021: U.S. Department of Education, National Center for Education Statistics, Integrated Postsecondary Education Data System (IPEDS) 2020 (http://nces.ed.gov/ipeds/); All Costs and Enrollments for 2019–2020: U.S. Department of Education, National Center for Education Statistics, Integrated Postsecondary Education Data System (IPEDS) 2019 (http://nces.ed.gov/ipeds/); All other: U.S. Department of Education, National Postsecondary Student Aid Study – Administrative Collection (NPSAS-AC) 2018 (http://www.nces.ed.gov/das).
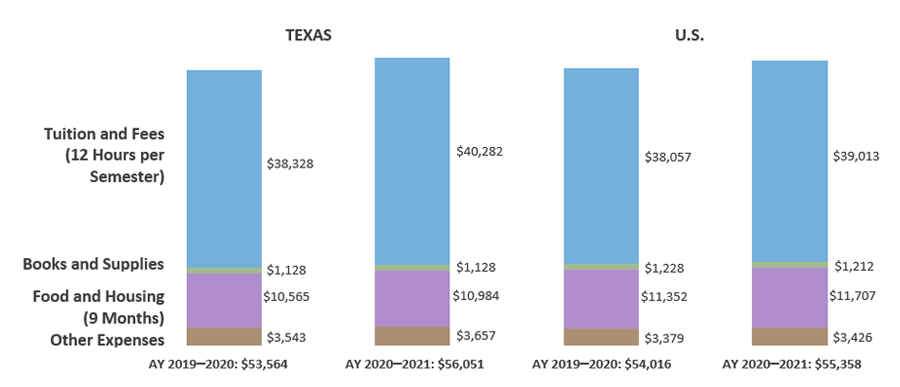
Costs at Texas Private Four-Year Universities Now Higher Than National Average
Weighted Average Private Four-year University Cost of Attendance for Two Semesters for Full-time Undergraduates Living Off Campus in Texas and the U.S. (AY 2019–2020 and AY 2020–2021)
* An institution’s costs are multiplied by its enrollment. The sum of costs for all schools is then divided by full-time, undergraduate enrollment, such that schools with higher enrollments are given greater weight. See glossary for clarification.
** 12 semester hours or more.
*** Expected Family Contribution is now known as the Student Aid Index. It is an index number that colleges use to determine a family’s eligibility for financial aid. The number is determined through a federal formula that considers family income and size as well as the number of children in college, among other factors. The average amount that families actually contribute to educational expenses is unknown.
Sources: All Costs and Enrollments for 2020–2021: U.S. Department of Education, National Center for Education Statistics, Integrated Postsecondary Education Data System (IPEDS) 2020 (http://nces.ed.gov/ipeds/); All Costs and Enrollments for 2019–2020: U.S. Department of Education, National Center for Education Statistics, Integrated Postsecondary Education Data System (IPEDS) 2019 (http://nces.ed.gov/ipeds/); All other: U.S. Department of Education, National Postsecondary Student Aid Study – Administrative Collection (NPSAS-AC) 2018 (http://www.nces.ed.gov/das).
The Cost of Going to College Continues to Rise Each Year
Change in Costs for Students Living Off Campus: Dollar and Percentage Change (AY 2019–2020 to AY 2020–2021, Costs Weighted for Enrollment*)
| Texas | Public Four-Year | Public Two-Year | Private Four-Year | |||
|---|---|---|---|---|---|---|
| $ | % | $ | % | $ | % | |
| Tuition and Fees (12 Hours / Semester) | $565 | 6% | $241 | 6% | $1,954 | 5% |
| Books and Supplies | -$4 | 0% | -$155 | -9% | $0 | 0% |
| Food and Housing | $571 | 6% | $479 | 5% | $419 | 4% |
| Other | $88 | 2% | $173 | 4% | $114 | 3% |
| Total Change | $1,220 | 5% | $173 | 4% | $114 | 3% |
| U.S. | Public Four-Year | Public Two-Year | Private Four-Year | |||
|---|---|---|---|---|---|---|
| $ | % | $ | % | $ | % | |
| Tuition and Fees (12 Hours / Semester) | $190 | 2% | $133 | 3% | $956 | 3% |
| Books and Supplies | -$64 | -5% | -$95 | -6% | -$16 | -1% |
| Food and Housing | $243 | 2% | $502 | 5% | $355 | 3% |
| Other | $178 | 4% | $94 | 2% | $47 | 1% |
| Total Change | $547 | 2% | $634 | 2% | $1,342 | 2% |
* An institution’s costs are multiplied by its enrollment. The sum of costs for all schools is then divided by full-time, undergraduate enrollment, such that schools with higher enrollments are given greater weight. See glossary for clarification.
Sources: All Costs and Enrollments for 2020–2021: U.S. Department of Education, National Center for Education Statistics, Integrated Postsecondary Education Data System (IPEDS) 2020 (http://nces.ed.gov/ipeds/); All Costs and Enrollments for 2019–2020: U.S. Department of Education, National Center for Education Statistics, Integrated Postsecondary Education Data System (IPEDS) 2019 (http://nces.ed.gov/ipeds/); Housing Demand: The Hechinger Report, “The Hidden Risk in Off-Campus Housing Costs,” August 23, 2019 (https://hechingerreport.org/the-hidden-risk-in-off-campus-housing-costs/); All other: U.S. Department of Education, National Postsecondary Student Aid Study – Administrative Collection (NPSAS-AC) 2018 (http://www.nces.ed.gov/das).
Living Situation Key to Staying Within Average Room and Board Budgets at Texas Public Universities
Average USDA/HUD Food and Housing Costs for Two Semesters (9 Months) for Counties and MSAs*** Where Texas Public Universities Are Located (AY 2020–2021)
| Student sharing 1-bedroom unit | Student sharing 2-bedroom unit | Student living alone in 1-bedroom unit | Single parent student with 1 child in 2-bedroom unit | |
|---|---|---|---|---|
| Food | $2,601 | $2,601 | $2,601 | $3,914 |
| Housing | $3,950 | $4,827 | $7,900 | $9,654 |
| Total Food and Housing | $6,551 | $7,428 | $10,501 | $13,568 |
| Average Room and Board Budget | $9,787 | $9,787 | $9,787 | $9,787 |
*$10,180 when weighted for enrollment; see glossary for clarification. ** Based on the cost at Domino’s Pizza near the University of Texas at Austin, April 2022. *** A Metropolitan Statistical Area is a geographic area of 50,000 or more inhabitants.
Sources: All Costs and Enrollments for 2020–2021: U.S. Department of Education, National Center for Education Statistics, Integrated Postsecondary Education Data System (IPEDS) 2020 (http://nces.ed.gov/ipeds/); U.S. Department of Agriculture. “Official USDA Food Plans: Cost of Food at Home at Four Levels, U.S. Average, June 2021.” (https://www.fns.usda.gov/cnpp/usda-food-plans-cost-food-reports-monthly-report); U.S. Department of Housing and Urban Development (HUD). “Fair Market Rents 2021 for Existing Housing, October 2021,” (http://www.huduser.org/datasets/fmr.html)
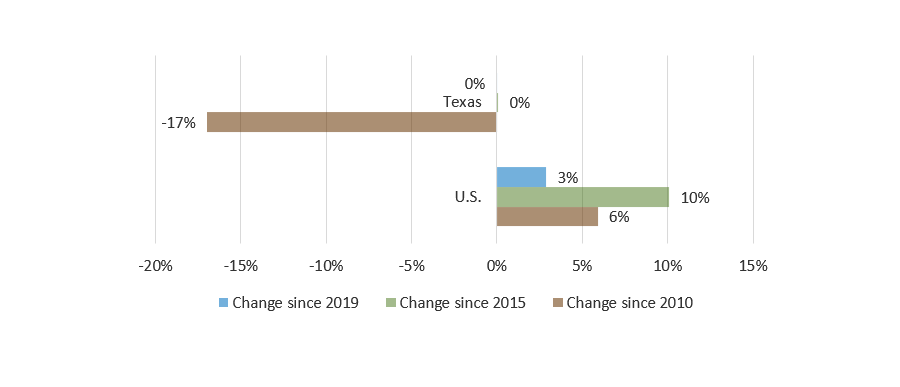
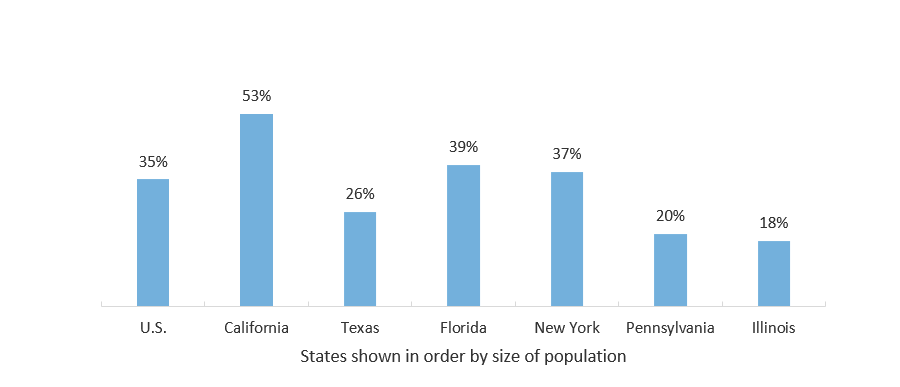
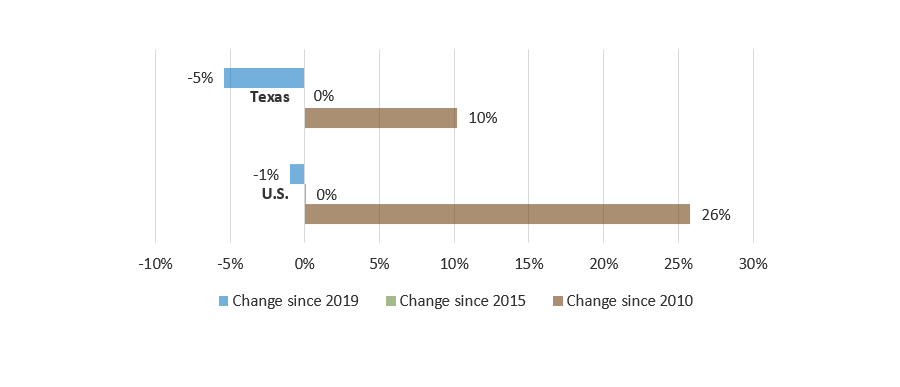
Average Tuition at Texas Public Four-Year Institutions Has Increased by 26 Percent Since 2008, Lower Than for the U.S.
Percent Change in Average Tuition at Public Four-Year Colleges, Inflation Adjusted, 2008-2019
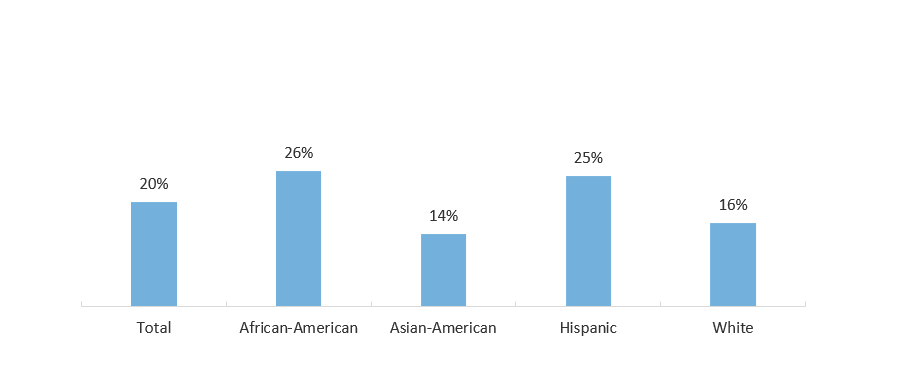
Average Net Price at a Texas Public Four-Year University as a Percentage of Texas Median Household Income, by Race (2018)
Sources: Center on Budget and Policy Priorities, States Can Choose Better Path for Higher Education Funding in COVID-19 Recession, February 2021 (States Can Choose Better Path for Higher Education Funding in COVID-19 Recession | Center on Budget and Policy Priorities (cbpp.org)).
Nearly Two-Thirds of Student Aid Comes from the Federal Government
Direct Student Aid by Source (AY 2019-2020*)
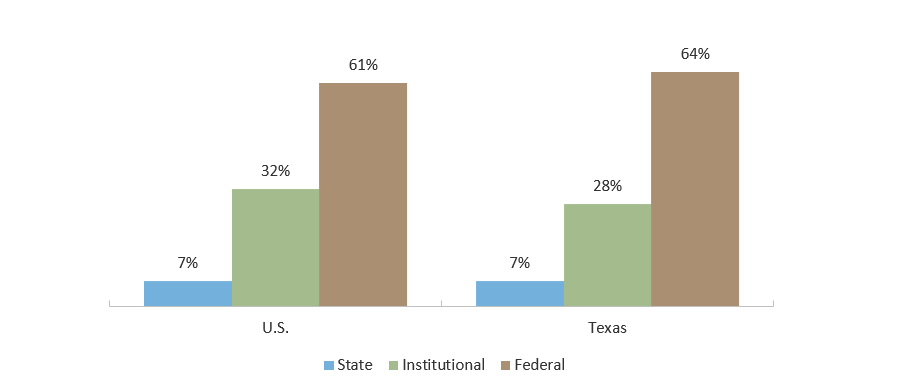
* Direct student aid includes aid that is generally available, goes directly to students, and derives from state and federal appropriations, plus institutional grants.
**The State of Texas, like other state governments, also supports public institutions through direct appropriations and tuition waivers.
Sources: Aid in Texas: Texas Higher Education Coordinating Board, Report on Student Financial Aid in Texas Higher Education, Fiscal Year 2020 (http://reportcenter.thecb.state.tx.us/reports/data/report-on-student-financial-aid-in-texas-higher-education-for-fy-2020/); Aid in the U.S.: The College Board. Trends in Student Aid 2021 (http://trends.collegeboard.org/).
Nearly Half of Aid is in the Form of Loans
Direct* Student Aid by Type (AY 2019-2020)
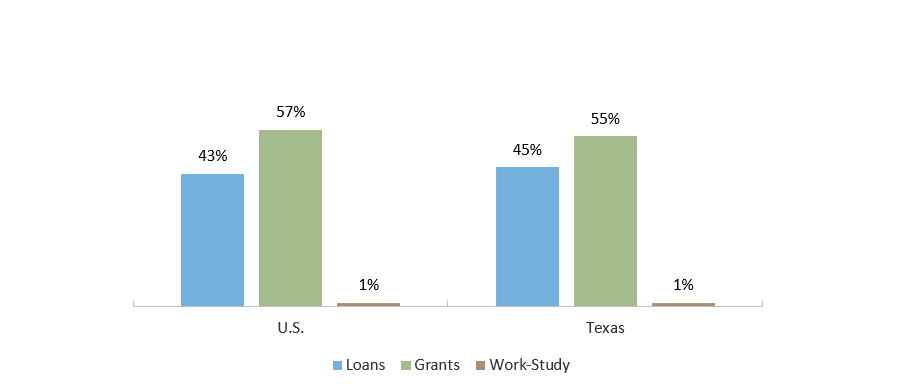
* Direct student aid includes aid that is generally available, goes directly to students, and derives from state and federal appropriations (including both FFELP and FDLP loans), plus institutional grants.
Sources: Aid in Texas: Texas Higher Education Coordinating Board, Report on Student Financial Aid in Texas Higher Education, Fiscal Year 2020 (http://reportcenter.thecb.state.tx.us/reports/data/report-on-student-financial-aid-in-texas-higher-education-for-fy-2020/); Aid in the U.S.: The College Board. Trends in Student Aid 2021 (http://trends.collegeboard.org/).
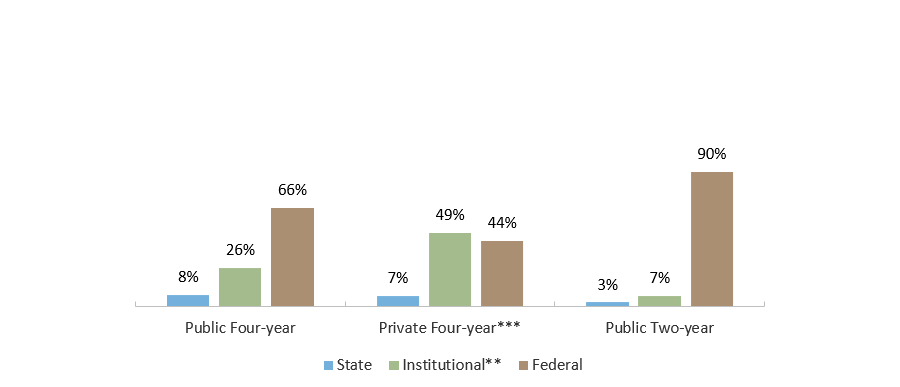
Texas Public Institution Students Are Most Heavily Dependent on Federal Student Aid
Direct Student Aid by Source in Texas, by Sector (AY 2019-2020*)
Direct Student Aid From All Sources by Type in Texas, by Sector (AY 2019-2020*)
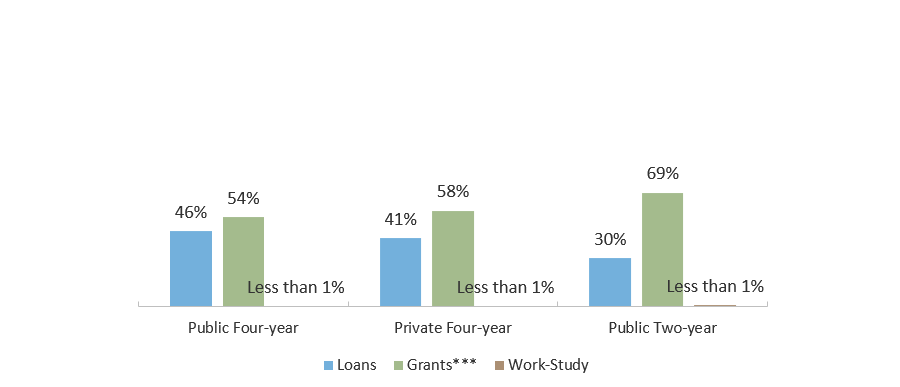
* Direct student aid includes aid that is generally available, goes directly to students, and derives from state and federal appropriations (including both FFELP and FDLP loans), plus institutional grants. Comparable aid data for the private for-profit (proprietary) sector is unavailable. Work-study aid is not included in this chart. It accounted for less than one percent of direct student aid in all sectors. Totals may not add to 100 percent due to rounding.
** Tuition exemptions and waivers are included in institutional aid for the public sectors.
*** Data on tuition exemptions and waivers is included in the Grants category.
Sources: Texas Higher Education Coordinating Board, Report on Student Financial Aid in Texas Higher Education, Fiscal Year 2020 (http://reportcenter.thecb.state.tx.us/reports/data/report-on-student-financial-aid-in-texas-higher-education-for-fy-2020/).
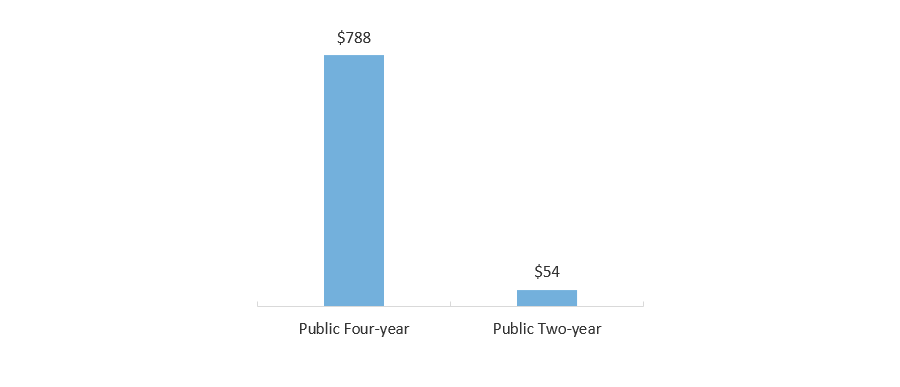
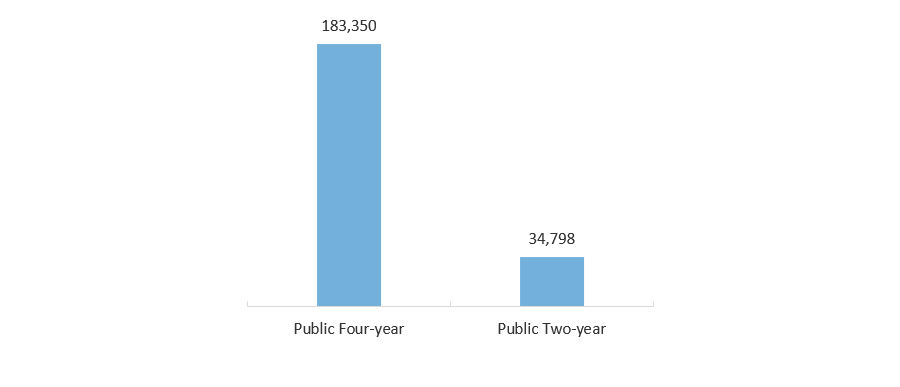
Students at Public Institutions in Texas Benefited from $842 Million in Exemptions and Waivers
FY 2020 Total Exemptions and Waivers Dollars, in Millions
FY 2020 Number of Recipients of Exemptions and Waivers
Sources: Texas Higher Education Coordinating Board, Report on Student Financial Aid in Texas Higher Education, Fiscal Year 2020 (http://reportcenter.thecb.state.tx.us/reports/data/report-on-student-financial-aid-in-texas-higher-education-for-fy-2020/).
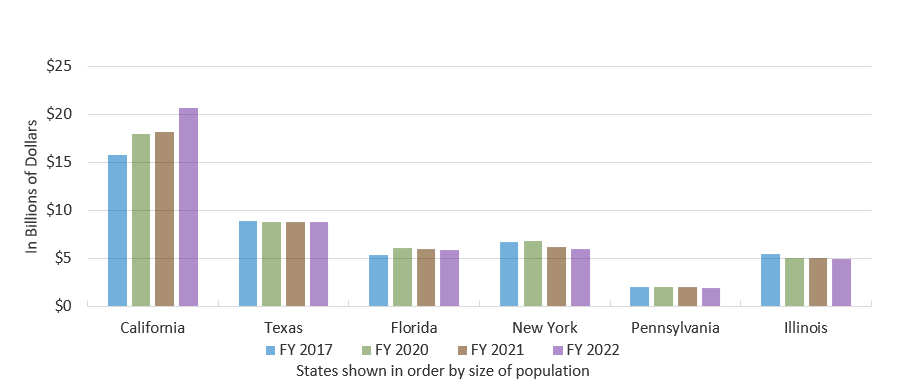
States Have Increased Support for Higher Education Over the Past Five Years
State Fiscal Support for Higher Education, by State and Year, in 2022 Dollars
Percentage of State Higher Education Support by Type and State, FY 2022
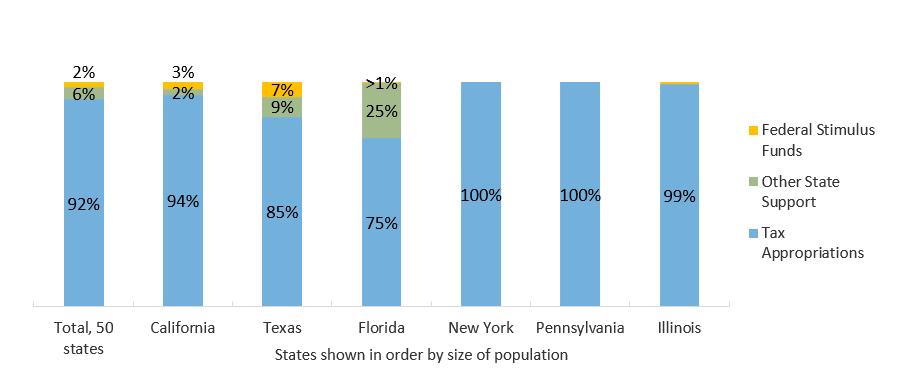
*This includes federal stimulus funding allocated to states for higher education. It excludes funds (such as HEERF) allocated directly to institutions or students.
Sources: State Higher Education Finance, Grapevine report on state fiscal support for higher education, 2022 (https://shef.sheeo.org/grapevine/).
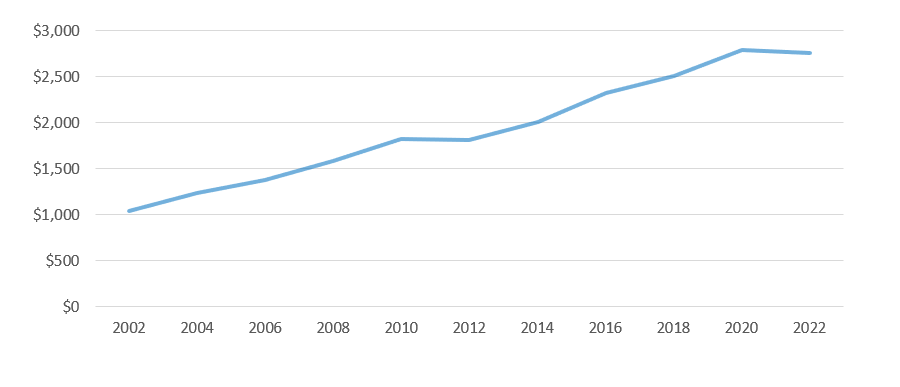
Community College Total Tax Revenue Saw Recent Declines
Estimated Total Tax Revenue of Texas Community Colleges, by Year, in Millions of Dollars (Adjusted to 2022 Dollars)
Estimated Total Tax Revenue of Texas Community Colleges, by Year and Location Type, in Millions of Dollars (Adjusted to 2022 Dollars)
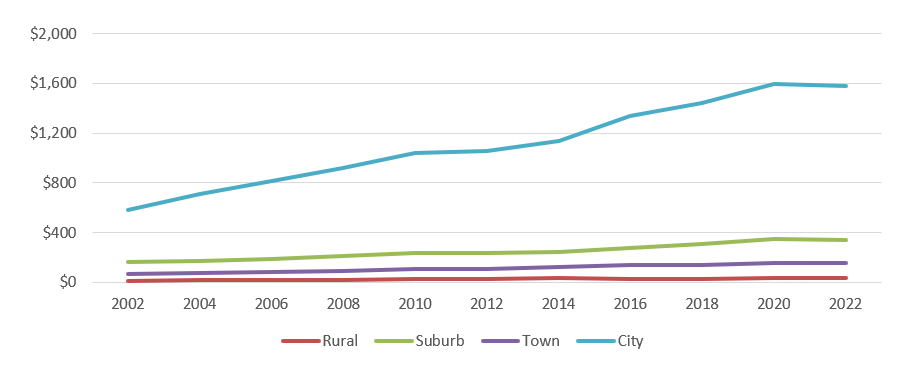
Note: Some community college districts have a mandatory tax rate freeze for certain citizens. The above figures are estimates based on projected tax rates and district valuation, not the actual amount collected by the district.
Sources: : Texas Association of Community Colleges (TACC), Tax & Valuation Survey Results (https://tacc.org/tacc/college-data).
Public Educational Appropriations Decreased in Texas Over the Last Ten Years
Percent Change in Public Higher Education Net Tuition Revenue Per Full-Time Equivalent Student (Constant Adjusted 2020 Dollars)
Percent Change in Public Educational Appropriations Per Full-Time Equivalent Student
(Constant Adjusted 2020 Dollars)