State of Student Aid in Texas – 2022
Section 6: Loans
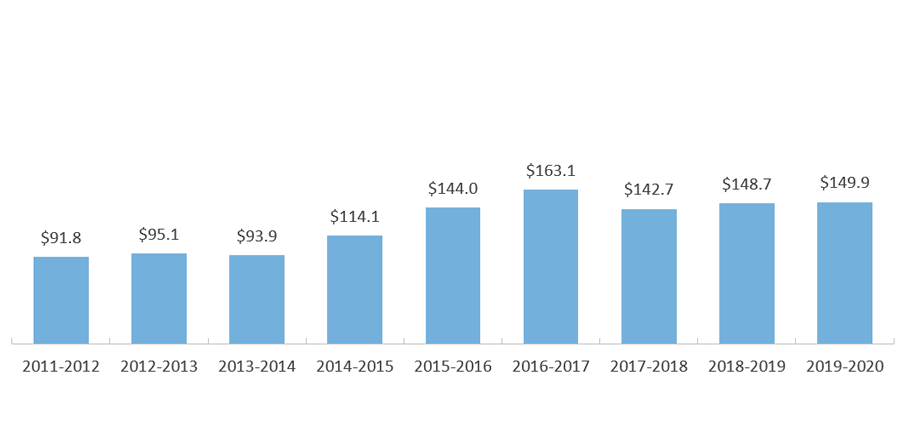
- Volume for the Largest State Loan Program, HHL-CAL, Increases
- HHL-CAL Loans Go Predominantly to Private Four-Year Schools
- HHL-CAL Volume Not Comparable to HBCU and HSI Enrollment
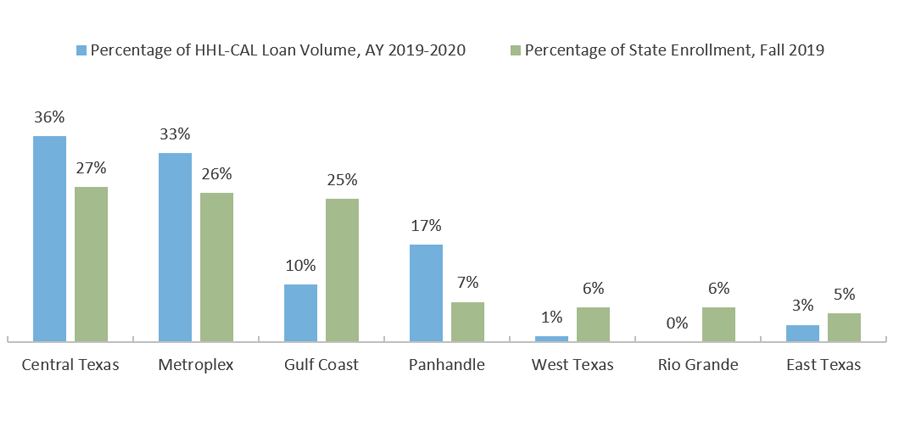
- Federal Loan Volume Concentrated in Rural Areas, More Widely Distributed in Urban Areas
- Four-Year Public Schools Account for Almost Two-Thirds of Federal Loan Volume
- Federal Loan Volume Is Proportionally More Than Enrollment at HSIs and HBCUs
- Veterans Less Likely to Borrow Student Loans Compared to Non-Veterans
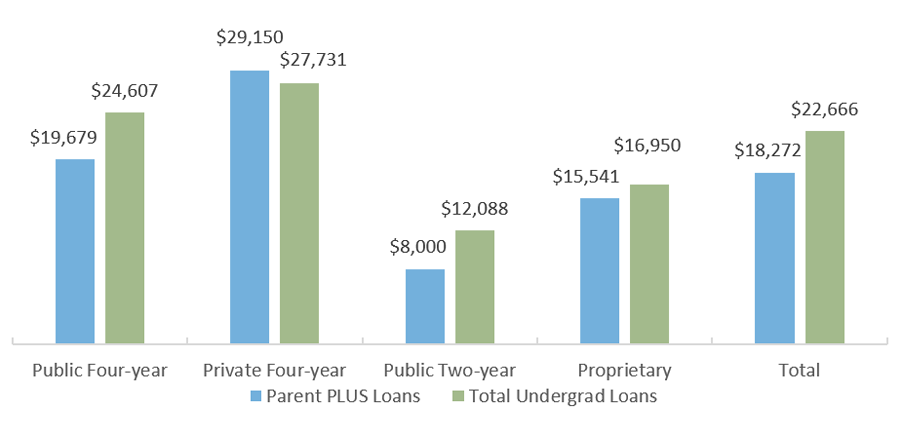
- Undergraduates Nationwide Borrowed More Than $22,000 For Their Education
Volume for the Largest State Loan Program, HHL-CAL, Increases
HHL-CAL Loan Volume by Award Year (in Millions of Dollars)*
HHL-CAL Volume and Enrollment by Region
* Includes only the amounts reported in the Texas Higher Education Coordinating Board’s Financial Aid Database. The Financial Aid Database primarily records aid that was based on financial need, but may include some amounts that were not based on need.
Sources: Loan volume: Texas Higher Education Coordinating Board (THECB), “Financial Aid Database for AY 2019–2020,” Austin, Texas, 2021 (Unpublished tables); Data on loan terms and loan eligibility: THECB, “College for Texans” Website (http://www.collegeforalltexans.com/apps/financialaid/tofa.cfm?Kind=L); Enrollment: THECB. Texas Higher Education Data (http://www.txhighereddata.org/).
HHL-CAL Loans Go Predominantly to Private, Four-Year Schools
HHL-CAL Volume and Student Enrollment by Sector
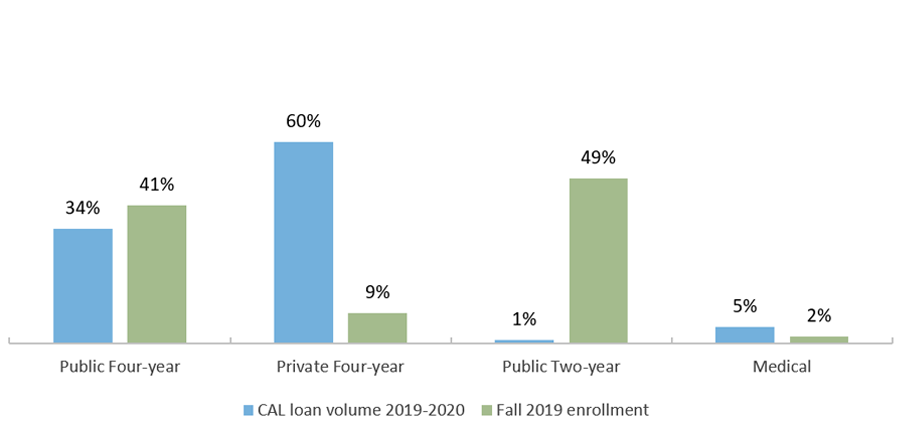
* HHL-CAL volume data for students who attended for-profit institutions are not available.
Sources: Loan volume: Texas Higher Education Coordinating Board (THECB). “Financial Aid Database, 2019-2020,” Austin, Texas, 2021 (Unpublished tables); Public Enrollment: U.S. Department of Education, National Center for Education Statistics, “Integrated Postsecondary Education Data System (IPEDS) 2020” (https://nces.ed.gov/ipeds/datacenter).
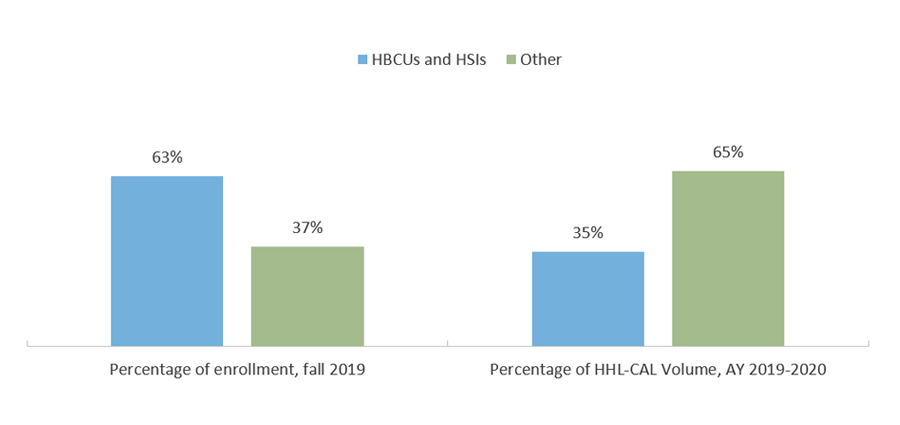
HHL-CAL Volume Not Comparable to HBCU and HSI Enrollment
HHL-CAL Volume and Enrollment*
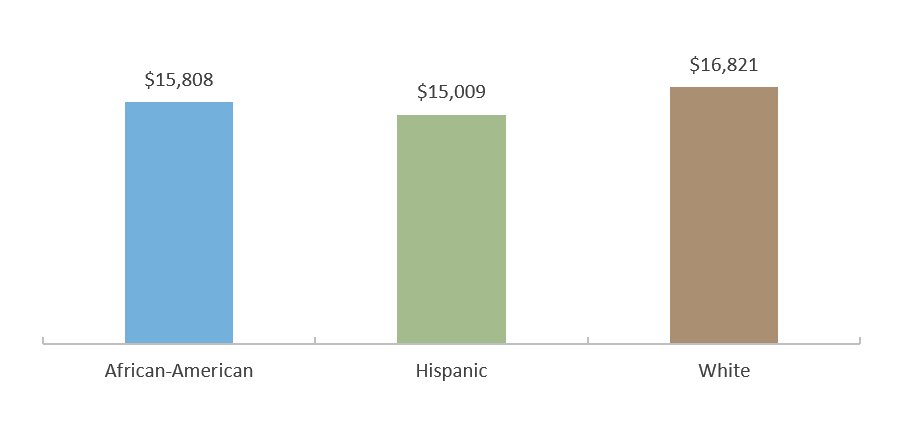
Average HHL-CAL Award by Ethnicity (AY 2019-2020)
* Includes only the amounts reported in the Texas Higher Education Coordinating Board’s Financial Aid Database. The Financial Aid Database primarily records aid that was based on financial need, but may include some amounts that were not based on need.
Sources: Loan volume and HBCU/HSI list: Texas Higher Education Coordinating Board (THECB). “Financial Aid Database for AY 2019–2020.” Austin, Texas, 2021 (Unpublished tables); Enrollment: THECB. Texas Higher Education Data (http://www.txhighereddata.org/). HBCUs: U.S. Department of Education, Office for Civil Rights database. “Accredited Postsecondary Minority Institutions” (http://www.ed.gov/about/offices/list/ocr/edlite-minorityinst.html)
Federal Loan Volume Concentrated in Rural Areas, More Widely Distributed in Urban Areas
Top Schools by Region (AY 2020–2021)
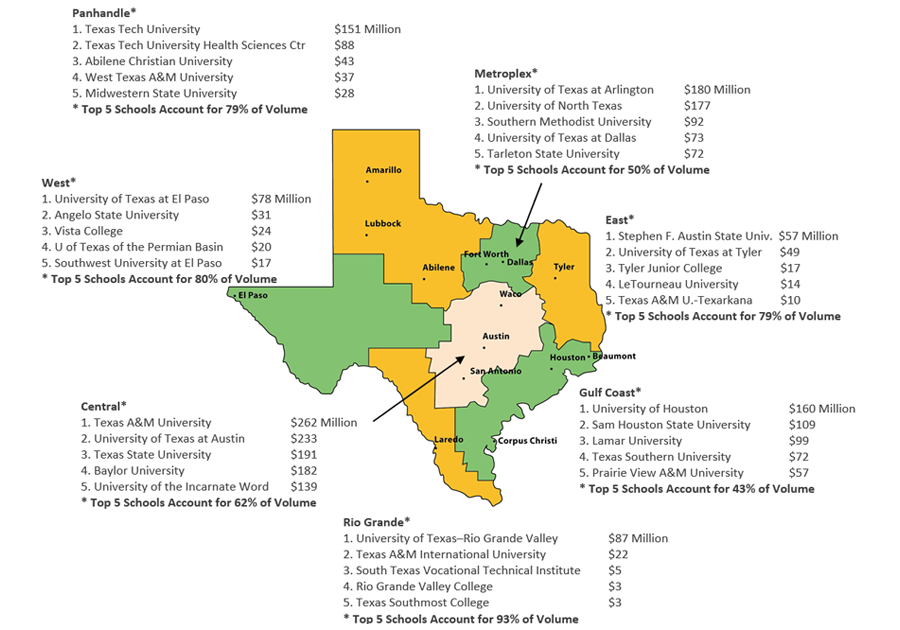
Sources: U.S. Department of Education, Federal Student Aid Data Center, Programmatic Volume Reports (https://studentaid.ed.gov/sa/about/data-center/student/title-iv).
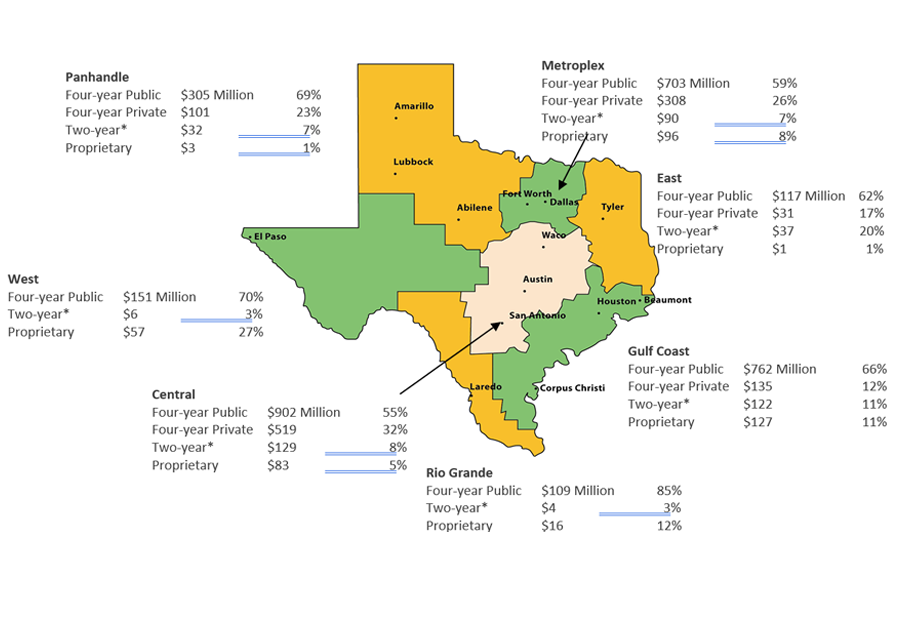
Four-Year Public Schools Account for Almost Two-Thirds of Federal Loan Volume
Federal Loan Volume by Region and School Type In Millions of Nominal Dollars (AY 2020–2021)
Texas Federal Loan Volume by School Type, AY 2020–2021
| School Type | Amount (in Millions) | % of Amount |
|---|---|---|
| Public Four-year | $3,049 | 62% |
| Private Four-year | $1,095 | 22% |
| Two-year* | $420 | 8 |
| Proprietary | $380 | 8% |
* The two-year category includes both public and private, not-for-profit, and excludes proprietary.
Sources: U.S. Department of Education, Federal Student Aid Data Center, Programmatic Volume Reports (https://studentaid.ed.gov/sa/about/data-center/student/title-ivl).
Federal Loan Volume Is Proportionally More Than Enrollment at HSIs and HBCUs
Ratio of Federal Loan Volume at HBCUs, HSIs and Non-HBCUs/HSIs*
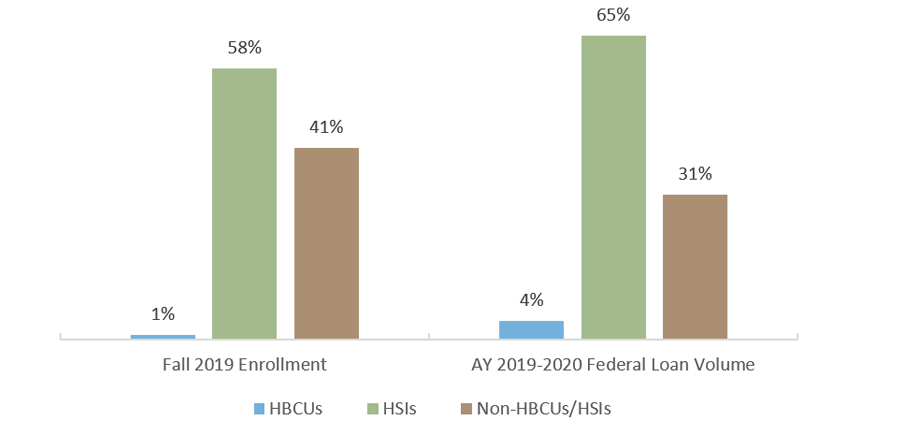
* Does not include proprietary schools for volume or enrollment.
Sources: Enrollment: U.S. Department of Education, National Center for Education Statistics, Integrated Postsecondary Education Data System (IPEDS) 2020 (http://nces.ed.gov/ipeds/); Loan Volume: U.S. Department of Education, Federal Student Aid Data Center, Programmatic Volume Reports (https://studentaid.ed.gov/sa/about/data-center/student/title-iv); HBCUs: U.S. Department of Education, Office for Civil Rights database. “Accredited Postsecondary Minority Institutions” (http://www.ed.gov/about/offices/list/ocr/edlite-minorityinst.html); HSIs: U.S. Department of Education, unpublished report (special request).
Veterans Less Likely to Borrow Student Loans Compared to Non-Veterans
Percent With and Without Student Loans by Veteran Status, In AY 2017-2018
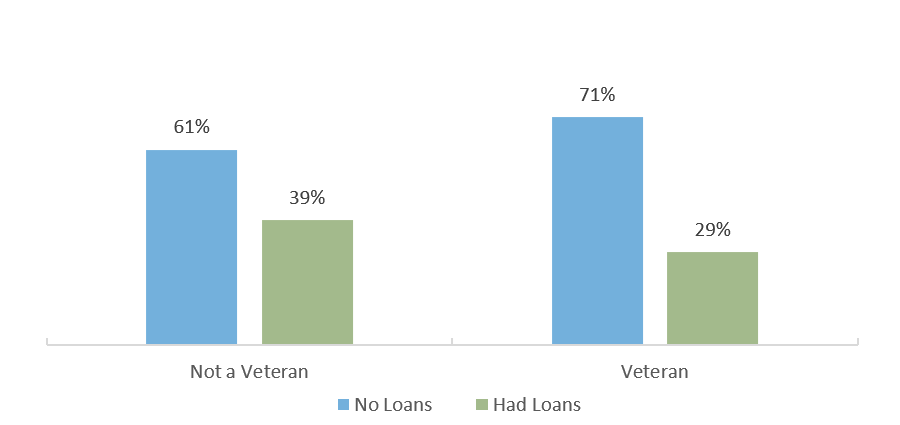
Sources: U.S. Department of Education, National Postsecondary Student Aid Study – Administrative Collection (NPSAS-AC) 2018 (http://www.nces.ed.gov/das).
Undergraduates Nationwide Borrowed More Than $22,000 For Their Education
Percentage of 2017-2018 Graduates Who Borrowed for Undergraduate Education, by Loan Type and Sector
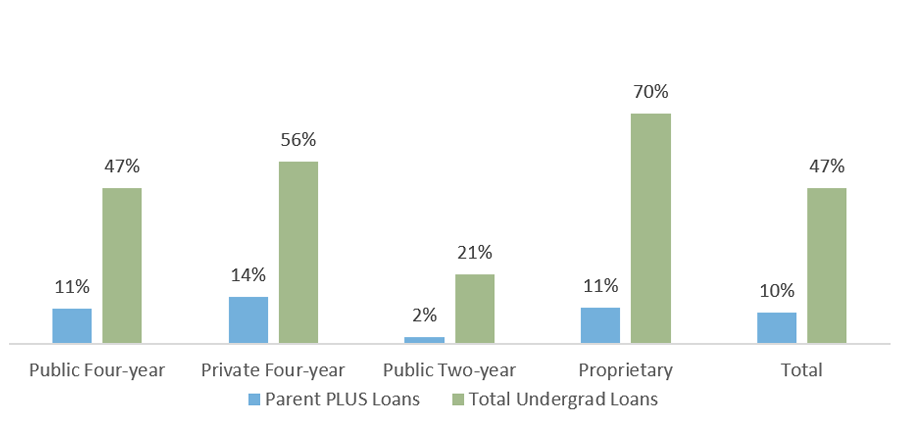
Cumulative Loans Borrowed by 2017-2018 Graduates, by Loan Type and Sector