
State of Student Aid in Texas – 2019
- By 2030, at least 60 percent of Texans ages 25-34 will have a postsecondary credential or degree.
- By 2030, at least 550,000 students in that year will complete a certificate, associate, bachelor’s, or master’s degree from a Texas public, independent, or for-profit college or university.
- By 2030, all graduates from Texas public institutions of higher education will have completed programs with identified marketable skills.
- By 2030, undergraduate student loan debt will not exceed 60 percent of first-year wage for graduates of Texas public institutions.
In focusing on student debt and workforce outcomes, goals three and four represent a new direction for the THECB. The plan has identified two key targets for containing student loan debt:
- Decrease the excess semester credit hours (SCH) that students attempt when completing an associate or bachelor’s degree to 12 by 2020, six by 2025, and three by 2030.
- Limit the need to borrow so that no more than half of all students who earn an undergraduate degree or certificate will have debt in 2030.
60x30TX Goal Updates
| 2015 (Baseline) | 2016 | 2017 | 2030 Goal | ||
|---|---|---|---|---|---|
| Overall Attainment Rate | 40.3% | 41.0% | 42.3% | 60% | |
| Completion Goals | Overall Completion Total | 311,340 | 321,410 | 333,920 | 550,000 |
| Hispanic Completion | 96,657 | 103,889 | 111,344 | 285,000 | |
| African American Completion | 38,964 | 38,813 | 41,027 | 76,000 | |
| Male Completion | 131,037 | 135,849 | 141,564 | 275,000 | |
| Economically Disadvantaged Completion | 114,176 | 119,490 | 124,178 | 246,000 | |
| Texas High School Graduates Enrolling in Texas Higher Education | 52.7% | 51.9% | 52.3% | 65% | |
| Marketable Skills Goal | Working or Enrolled Within One Year | 78.9% | 78.8% | 78.8% | 80% |
| Student Debt Goals | Student Loan Debt to First-Year-Wage Percentage | 59.5% | 59.8% | 58.9% | 60% |
| Excess SCH Attempted | 19 | 19 | 18 | 3 | |
| Percent of Undergraduates Completing with Debt | 49.2% | 48.2% | 47.2% | 50% |
Sources: Texas Higher Education Coordinating Board. THECB 60×30 Progress Report, July 2018 (http://www.60x30tx.com/media/1406/2018-60x30tx-progress-report.pdf).
Student Aid Programs
- Turn the Texas College Work-Study program into Texas WORKS, which would create a centralized off-campus work-study program aimed at low-income students.
- Limit the total semester credit hours for which a student can receive a TEXAS Grant (from 150 to 135 total semester credit hours).
- Expand TEOG eligibility to community college students who are enrolled in their school’s baccalaureate degree programs.
Core Curriculum Changes for Transfer
- Create statewide specialized core curriculums to help ensure courses will apply to majors and possibly reduce the number of total hours required for the core, and make core curriculum information more available online.
- Feasibility study on a transfer admissions guarantee program.
Dual Credit Changes
- Dual Credit – require that high school students demonstrate college readiness in the disciplines they want to take dual credit courses in.
Additionally, THECB also recommends creating a graduation bonus to award institutions for graduates, including a larger bonus for graduates who were at-risk students. This bonus could help further incentivize institutions to meet the degree completion goals of the statewide strategic plan for Texas higher education, 60x30TX.
Sources: Texas Higher Education Coordinating Board (THECB), Legislative and Media Resources, Higher Education Policy and Appropriations, “Legislative Recommendations to the 86th Texas Legislature” (2018) (http://www.thecb.state.tx.us/index.cfm?objectid=B71C18F0-2E0B-11E8-BC500050560100A9).
Major Texas Financial Aid Programs
Funding in 2016-2017 (Adjusted) and 2018-2019 Biennia
| 2016-2017 Biennium Funding (in millions, rounded) | 2018-2019 Biennium Funding (in millions, rounded) | Percent Change | |
|---|---|---|---|
| Towards EXcellence Access and Success (TEXAS) Grant | $715 | $787 | 10% |
| Texas Educational Opportunity Grant (TEOG) | $94 | $96 | 2% |
| Texas Work-Study | $19 | $19 | 0% |
| Tuition Equalization Grant (TEG) | $192 | $172 | -10% |
| B-on-Time Loan | $83 | $18 | -78% |
| Total | $1,103 | $1,092 | -1% |
Other Texas Financial Aid Programs
Funding in 2016-2017 (Adjusted) and 2018-2019 Biennia
| 2016-2017 Biennium Funding (in millions, rounded) | 2018-2019 Biennium Funding (in millions, rounded) | Percent Change | |
|---|---|---|---|
| Top Ten Percent Scholarship | $18 | $3.2 | -83% |
| Developmental Education | $4.0 | $2.7 | -33% |
| Texas Research Incentive Program | $138 | $35.0 | -75% |
| Professional Nursing Shortage Reduction Program | $33.8 | $20.0 | -41% |
| Teach for Texas Loan Repayment Assistance Program | $4.4 | $2.8 | -36% |
| Physician Education Loan Repayment Program | $33.8 | $25.4 | -25% |
| Texas Armed Services Scholarship | $5.4 | $2.7 | -50% |
Sources: Texas Higher Education Coordinating Board, “Higher Education Summary of the 85th Texas Legislature (Regular Session),” 2017 (http://www.thecb.state.tx.us/reports/PDF/9771.PDF?CFID=74388826&CFTOKEN=21078051); Texas Higher Education Coordinating Board, “Higher Education Summary of the 84th Texas Legislature (Regular Session),” 2015 (http://www.thecb.state.tx.us/reports/PDF/6793.PDF?CFID=74390564&CFTOKEN=34248304); Texas Legislative Budget State Budget by Program (http://sbp.lbb.state.tx.us/); Watkins, Matthew (2017). “In a year of cuts, the Texas Legislature boosted financial aid for college students”. Texas Tribune. https://www.texastribune.org/2017/06/07/year-cuts-texas-legislature-boosted-financial-aid/
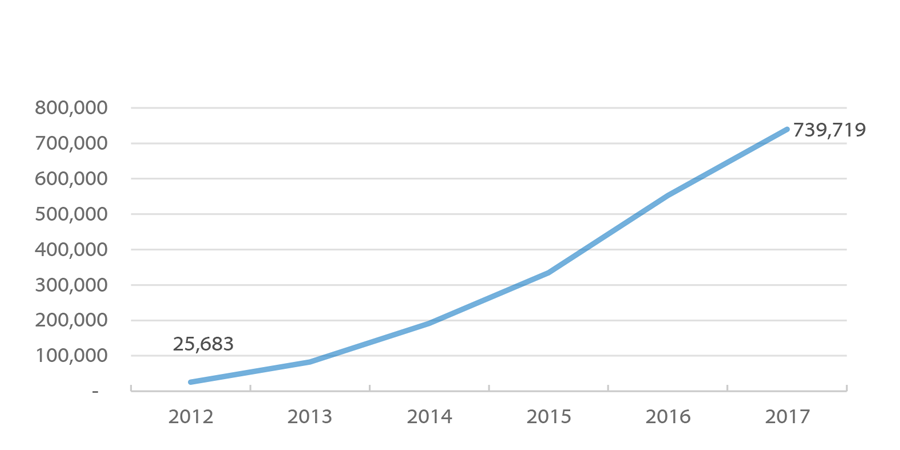
Estimated Outanding Student Debt in Texas
(in billions*)
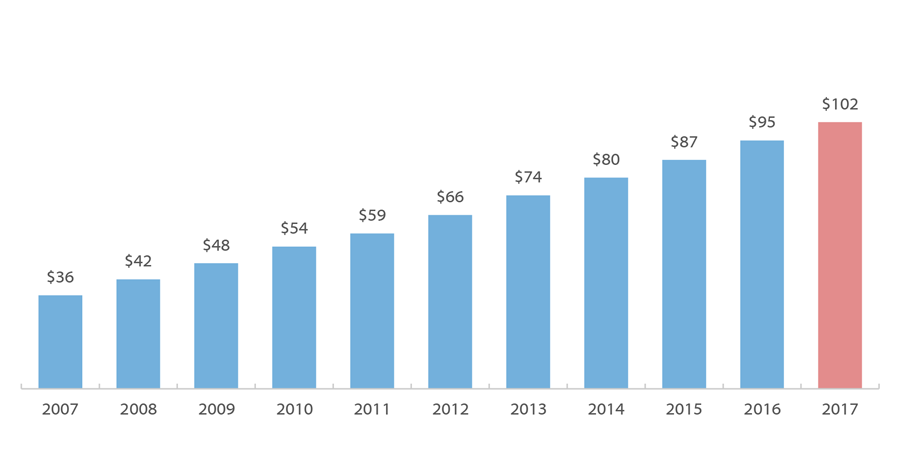
While the growth rate of Texas student loan debt exceeds the overall U.S. growth rate, both rates have slowed somewhat in recent years. Texas has added about $7 billion per year in outstanding student loan debt since 2012, resulting in higher absolute growth but lower percentage growth than in previous years. For the U.S., absolute debt growth of about $75 billion annually since FY 2014 has been smaller than usual, such that the annual percentage growth has declined even more quickly.
At the state and national level, the majority of the outstanding student loan debt comes from federal loans, including Federal Family Education Loans (FFEL)**, Federal Direct Loans, and Federal Perkins Loans. Private and state-level education loans, which generally do not provide accommodations like income-linked repayment plans, deferments, or forgiveness, accounted for about 11 percent of student loans borrowed in AY 2016-17. Texas students are more dependent on federal aid, including federal student loans, than students nationally.
*Estimates are based on state-level per capita student debt averages from the Federal Reserve Bank of New York Consumer Credit Panel, which excludes persons without credit reports and persons living in counties where fewer than 10,000 people have credit reports. The result for a given year is adjusted by the same factor by which the result of this methodology for the United States as a whole deviates from the United States total outstanding student debt for that year as reported in the Quarterly Report on Household Debt and Credit. This adjustment, which was not made in some previous editions of SOSA, has been applied to all years.
**The FFEL Program ended in 2010, but borrowers are still making payments on outstanding FFEL balances.
Sources: U.S. Student Loan Debt Estimate: Federal Reserve Bank of New York (FRBNY), Quarterly Report on Household Debt and Credit, 2017:Q4 (https://www.newyorkfed.org/medialibrary/interactives/householdcredit/data/pdf/HHDC_2017Q4.pdf), Texas Student Loan Debt Estimate: FRBNY Quarterly Report on Household Debt and Credit, Q4 2007 through Q4 2017, and Household Debt and Credit Statistics by State (https://www.newyorkfed.org/medialibrary/Interactives/householdcredit/data/xls/area_report_by_year.xlsx); Non-federal borrowing: College Board. Trends in Student Aid 2017 (https://trends.collegeboard.org/student-aid/figures-tables/total-federal-and-nonfederal-loans-over-time).
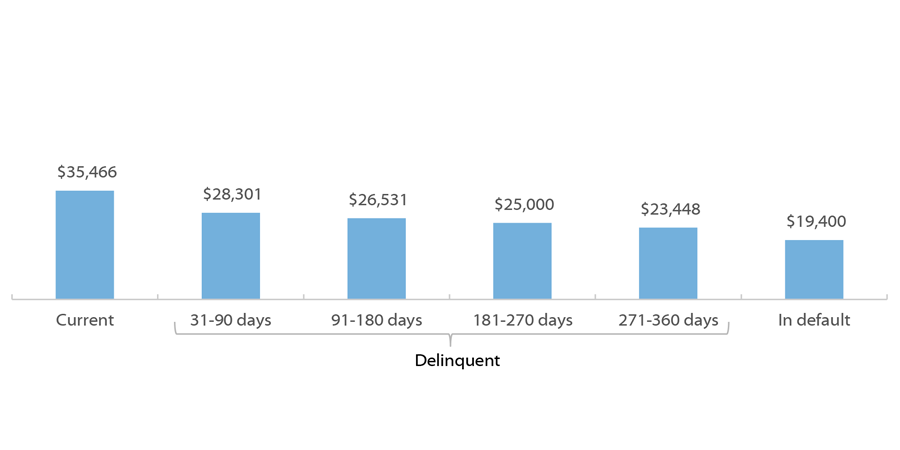
Although the average loan balance continues to climb, the relationship between this trend and default rates is not straightforward. In fact, borrowers who are current on their loans tend to have higher balances, while those in delinquency or default tend to have lower balances. This counterintuitive pattern has one key cause: Borrowers incur higher debts by staying in school longer.
National Average Loan Balance by Loan Status for Federal Direct Loans
(Current dollars; as of Q3 2018)
Degree Attainment and Default as of 2009 by 2009 Federal Student Loan Balance for Borrowers Who Started College in 2003-2004
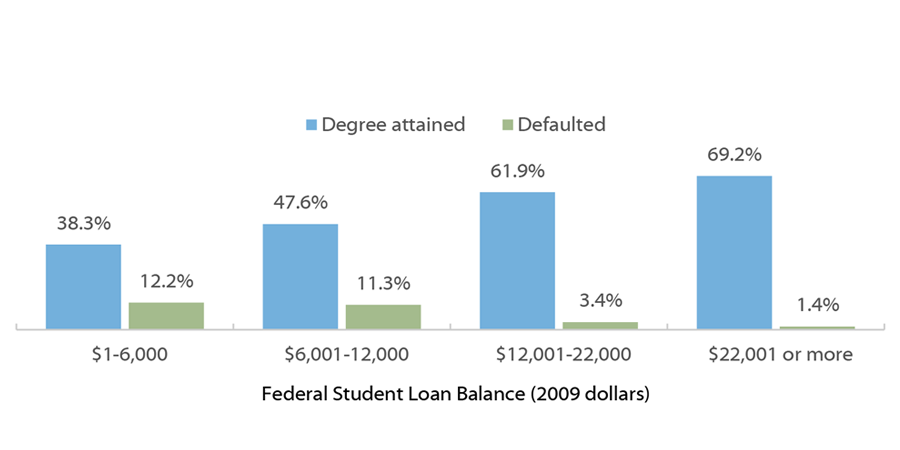
The common explanation for the inverse relationship between borrowing and default is that persisting to graduation requires more borrowing but also leads to higher incomes, such that the loan payments are actually more affordable. Data support this explanation, but it is incomplete. Provisions like deferments and income-driven repayment plans offer borrowers effective means to avoid defaulting on federal student loans regardless of income. Helping borrowers acquire the knowledge and skills to navigate the repayment process early on can be an effective default prevention strategy for all borrowers, especially those more likely to drop out and be at greatest risk of default.
Sources: Cohort default rate: U.S. Dept of Education, “Official Cohort Default Rates for Schools”, (http://www2.ed.gov/offices/OSFAP/defaultmanagement/cdr.html ); Lifetime default projection: U.S. Office of Management and Budget, FY 2017 Budget for Dept of Education, (https://www.whitehouse.gov/sites/default/files/omb/budget/fy2017/assets/edu.pdf ); 12-year default study: Woo, J. et al (2017). Repayment of Student Loans as of 2015 Among 1995-96 and 2003-04 First-Time Beginning Students. NCES. (https://nces.ed.gov/pubs2018/2018410.pdf); Attainment and default: Author’s analysis of U.S. Dept of Education, National Center for Education Statistics, 2003-04 Beginning Postsecondary Students Longitudinal Study (BPS:04/09).
Students who received BOT loans consistently graduated at higher rates than students who received aid but no BOT loan. About forty percent of public university students with BOT loans graduated in four years, compared to 29 percent for non-BOT aid recipients. According to the Texas Higher Education Coordinating Board (THECB), “these data suggest that the prospect of loan forgiveness may have been a strong enough incentive to influence behavior leading to more timely graduation”.
Graduation and Persistence Rates of BOT Recipients and Non-Recipients who Received Other Aid, by Sector (program lifetime)
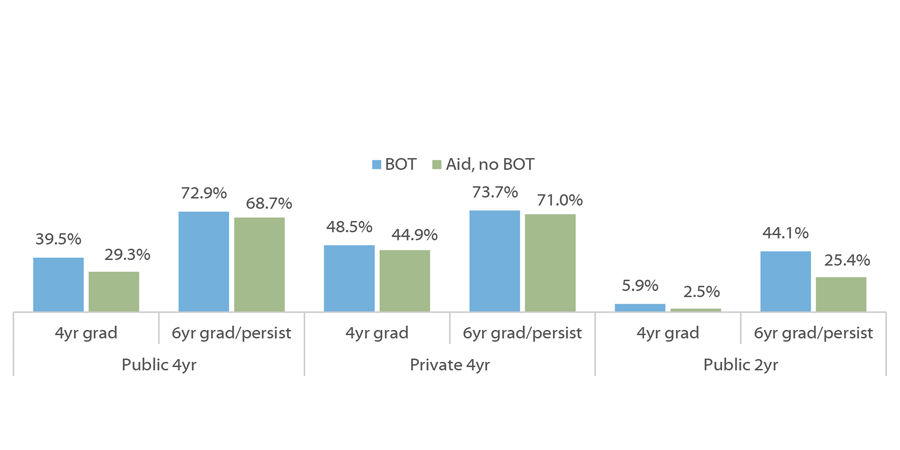
Despite its promise, the BOT program was underutilized. Thirty-six percent of funds were not allocated in FY 2011, and only five out of 136 institutions disbursed their entire allocation. Four-year private institutions used 90 percent of their funds, while public universities used 64 percent. Community colleges used only 3 percent of their allocation.
In 2013, the Sunset Advisory Commission identified several issues hindering the BOT program. These included both poor structural fit and inadequate funding at community colleges, strict eligibility requirements, complexity, and lack of awareness. Federal “preferred lender list” rules likely contributed to this lack of awareness. Created to prevent conflicts of interest with private student lending, the rules prevent college staff from volunteering information about non-federal loans unless the institution develops a “preferred lender list”. This process entails risks to the institution and diverts scarce administrative resources. Public institutions, whose lower costs are less likely to require non-federal borrowing, are less likely to have preferred lender lists; this may partially explain their low utilization rates relative to private institutions. Acknowledging this issue, the Commission concluded that, “despite its flaws, the state benefits from a program [BOT] that supports access to college through no-interest loans and encourages graduation.” The Commission made several recommendations to improve the program, but the state opted to phase it out.
Source: Texas Higher Education Coordinating Board (THECB), Report on student financial aid in Texas higher education for fiscal year 2015, September 2016 (http://www.thecb.state.tx.us/reports/PDF/8504); Utilization: Sunset Advisory Commission, Staff report with hearing material: Texas Higher Education Coordinating Board, July 2013, pp. 48 (https://www.sunset.texas.gov/public/uploads/). .
Borrowers who pursue PSLF take a risk. PSLF applies only to borrowers who enroll in IDR plans, which lower monthly payments but extend the payment period, resulting in higher interest costs over time. Borrowers who spend several years in IDR making qualifying payments can still lose eligibility due to employment changes, income growth, or Congressional action altering the PSLF terms; these borrowers now may face higher costs than if they had attempted to repay on the Standard Repayment Plan. Borrowers may also choose to pursue forgiveness through payment caps on certain IDR plans, though these options take longer and are also subject to Congressional action, and the Internal Revenue Service may tax this forgiveness as income (amounts forgiven under PSLF are not taxed).
Cumulative Borrowers Pursuing Public Service Loan Forgiveness (through 7/30/2017)
Despite the uncertainty surrounding PSLF, it is increasingly popular, with 936,029 borrowers having certified their employers’ eligibility as of June 30, 2018. The chart above represents unique borrowers who have received approval for an Employment Certification Form. The Department of Education introduced the voluntary Employment Certification Form (ECF) in 2012 to help borrowers establish eligibility and track their progress towards 120 qualifying payments. Though borrowers can wait to document their eligibility until requesting forgiveness, the number of borrowers who have had at least one ECF approved is currently the best proxy for borrowers pursuing PSLF. The Department has also denied over 841,000 ECFs since 2012 (this counts denials issued to borrowers who may have been denied previously).
Sources: U.S. Department of Education, Federal Student Aid: https://studentaid.ed.gov/sa/repay-loans/forgiveness-cancellation/public-service/questions; U.S. Department of Education, Federal Student Aid, PSLF Employment Certification Forms Report: https://studentaid.ed.gov/sa/about/data-center/student/portfolio; U.S. House Committee of Education and the Workforce, PROSPER Act: https://www.congress.gov/bill/115th-congress/house-bill/4508
- SB 19 would have frozen four-year public university tuition and fees at 2016-17 levels.
- SB 543 would have prohibited institutions from raising tuition at a rate greater than the rate of inflation unless they met at least six of 11 performance targets and would have prohibited any tuition increase larger than three percent.
Although the Legislature ultimately did not pass these bills (SB 19 passed the Senate), it did create a committee to explore higher education financing in the interim before the 86th Legislature. The Joint Interim Committee on Higher Education Formula Funding was charged to examine the two methods through which the Legislature directly appropriates funds to public universities:
- Formula funding
- Based on rates applied to various budget categories, like Instruction and Operations, Educational and General Space, and Contact Hours, but spending is not limited to those purposes
- Some differences based on institutional sector, notably that the formula for Technical State Colleges is entirely based on the incomes of graduates relative to the minimum wage, and ten percent of community college formula funding is based on academic success metrics
- Non-formula funding (“Support items”, etc.)
- Must be used for explicitly specified purposes, though some funds offer flexibility
- Includes Support items (formerly “special items”), which include Institutional Enhancement, instruction support, public service items, research, health care, and residency training items; and general research funds (e.g. Research Development Fund, Competitive Knowledge Fund)
2018-19 Texas Legislative Higher Education Appropriations (All Funds) by Sector and Fund Type
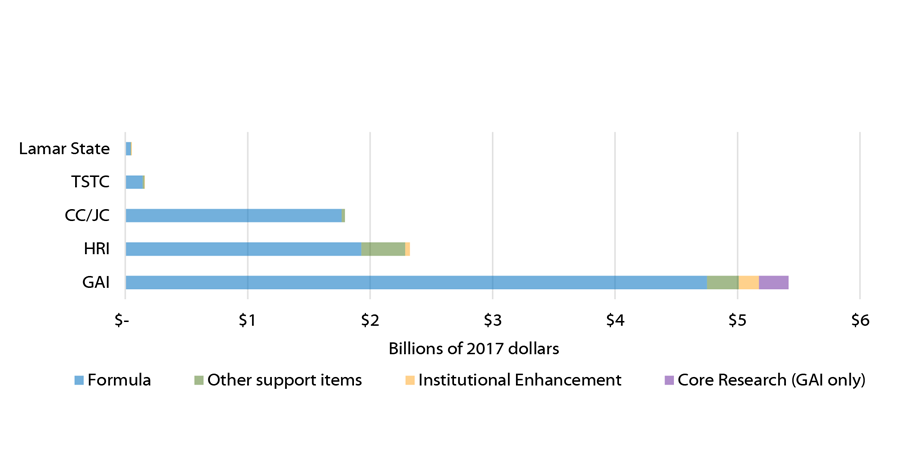
The mix of formula and non-formula funding allocated in the 2018-19 General Appropriations Act varied significantly between institutional sectors. By volume, non-formula funding was highest for General Academic Institutions (GAI), but by proportion it was highest for Health-Related Institutions (HRI) and Lamar State Colleges. Appropriations to GAIs (including system offices) consisted of about $4.75 billion in formula funding and $666 million in non-formula funding for a non-formula funding percentage of about 12 percent. For HRIs, non-formula funding of $398 million constituted about 17 percent of appropriations, given $1.93 billion in formula funding. Non-formula funding is also about 17 percent of the appropriations for Lamar State Colleges, which totals about $53.4 million, but 11 percent of appropriations for Texas State Technical Colleges (TSTC) and only 2 percent of the $1.8 billion appropriated to community and junior colleges (CC/JC).
Source: Texas Legislative History: https://capitol.texas.gov/ ; Joint Interim Committee: http://www.senate.state.tx.us/cmte.php?c=940; 2018-19 Texas Higher Education Appropriations: Legislative Budget Board, General Appropriations Act for the 2018-19 Biennium, http://www.lbb.state.tx.us/Documents/GAA/General_Appropriations_Act_2018-2019.pdf ; Summary of Higher Education Non-formula Support Items, http://www.lbb.state.tx.us/Documents/Publications/Presentation/Summary_Higher_Education_Non-formula_Support.pdf ; Texas Higher Education Coordinating Board, Overview of Formula Funding, http://www.thecb.state.tx.us/index.cfm?objectid=4EA741D3-C76D-FBC5-04F664C233E8802B
Non-Formula Funding as Percentage of TX Legislative Appropriations to GAIs, by Biennium
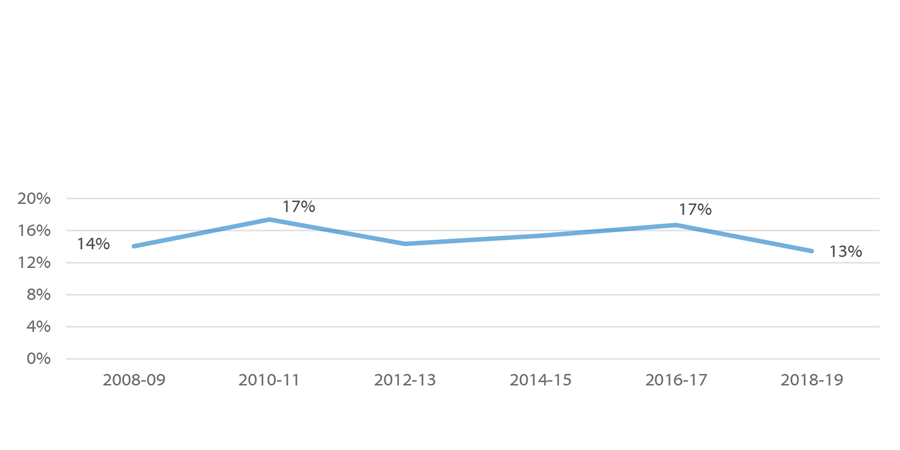
The drop in the percentage of non-formula GAI appropriations is due to the increase in formula funds by about $85 million and decrease in non-formula funds by about $198 million from the 2016-17 budget, resulting in a net decrease of GAI appropriations of about $123 million. Appropriations decreased in every major category of non-formula funding, but the bulk of the decrease occurred in Institutional Enhancement (down about 30 percent from $235 million to $166 million) and other support items (down about 25 percent from $346 million to $258 million). As shown in the chart below, the decrease in Institutional Enhancement reflects the historical trend, while the decrease in other support items represents a partial return to the historical norm after a spike in 2016-17.
Composition of TX Non-Formula Funding to GAIs, by Subcategory and Biennium
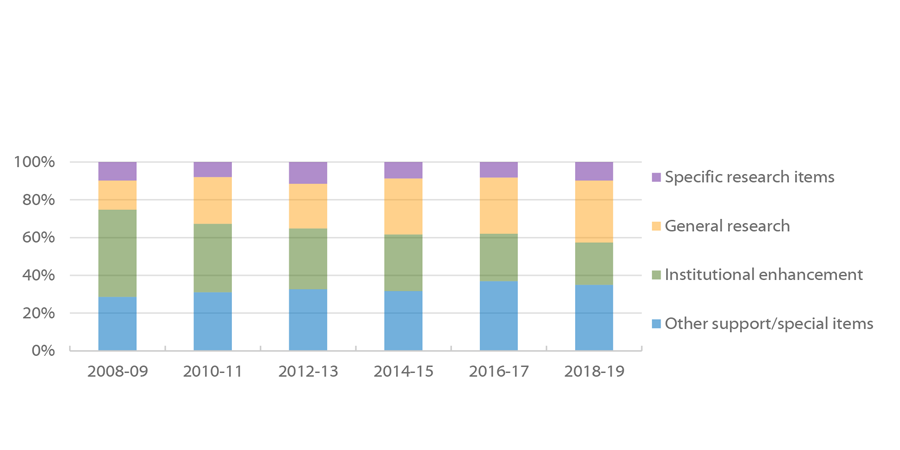
The two major trends in the composition of non-formula appropriations are the growth of general research funds, which have roughly doubled to 33 percent since 2008-09, and the decrease in Institutional Enhancement, cut by more than half to 22 percent over the same period.
Notes: These subcategories compare to the structure of the General Appropriations Act as follows: Institutional Enhancement is a single line item under Non-Formula Support Items; specific research items are line items under the Research subheading of Non-Formula Support Items; other support items are all other items under Non-Formula Support Items; and general research funds includes the Research Development Fund, the Comprehensive Research Fund, Core Research Support, and the Competitive Knowledge Fund. These items have not all existed or been funded in every budget since 2008-09, and only some fall under Non-Formula Support Items.