
State of Student Aid in Texas – 2018
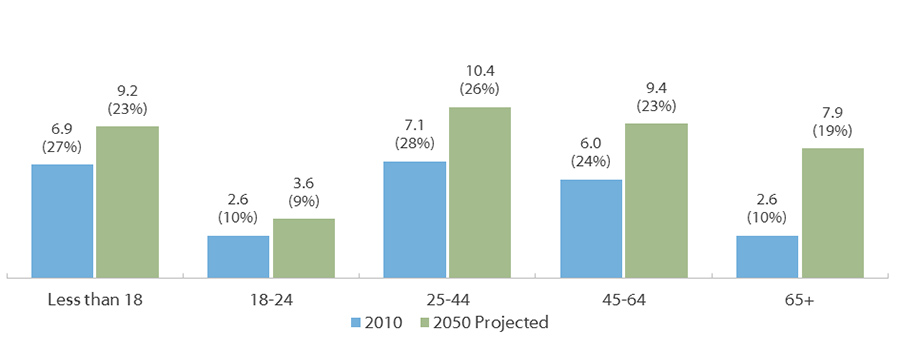
Texas Population by Age in Millions and Percentage of Total in Each Year: 2010 and 2050 (Projected*)
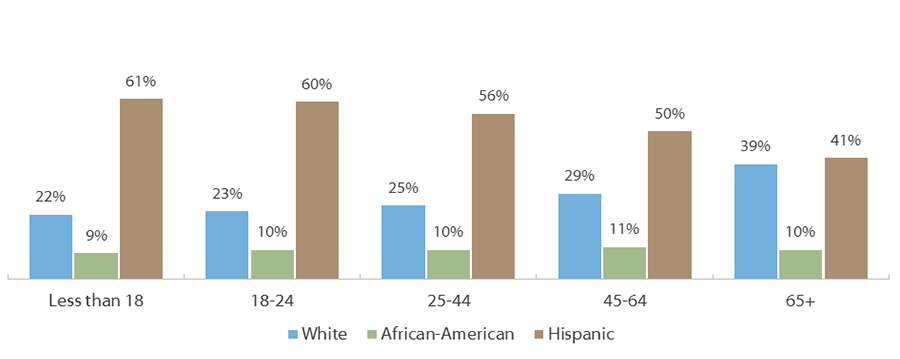
Projected* 2050 Population by Age and Ethnicity in Texas
From 2010 to 2050,* Texas is expected to add 2.3 million more children under age 18 and one million more adults age 18 to 24 — the traditional college age population. The population age 25 to 64 will grow by almost seven million, while the numbers of those aged 65 and older will swell by more than five million. Despite the increase in the number of children and young adults, people age 24 and younger will actually drop as a percentage of the population, from 38 percent to 32 percent. Meanwhile, people age 65 and older will increase from 10 percent to 19 percent.
As Texas changes from a majority-White to majority-Hispanic state, and experiences an increase in the percentage of the elderly population, a significant difference emerges with respect to population by age. In 2050,* 61 percent of children, 60 percent of 18- to 24-year-olds, and 56 percent of 25- to 44-year-olds will be Hispanic. By contrast, only 41 percent of those 65 and older will be Hispanic. The African-American population will remain relatively stable, at nine percent to 11 percent of each age group. Increasingly, the future of Texas, including its economic prosperity, as well as the expertise needed to run business, government, and infrastructure, will depend on the education of its non-White populations, which historically have had lower incomes, higher rates of poverty, and lower likelihood of attending and completing college than Whites.
* Based on the 0.5 scenario, which assumes half the net migration into state as was recorded from 2000 to 2010. The State Demographer suggests that the 0.5 scenario is most appropriate for long-term planning.
Source: Texas State Data Center and Office of the State Demographer, “Texas Population Projections Program: 2014 Population Projections”, Population Projections for State of Texas by Age Group (http://osd.texas.gov/Data/TPEPP/Projections/ ).
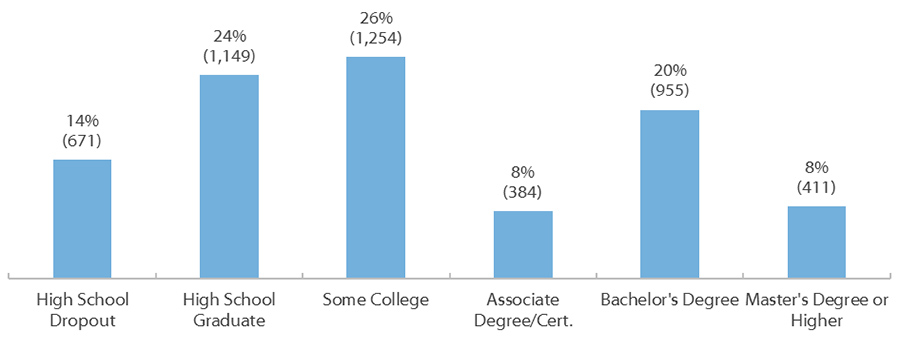
Projected Percentage (and Number in Thousands) of Job Openings in Texas by Typical Entry Education Level, 2010-2020
Projected Percentage (and Number in Thousands) of Total Jobs in Texas by Typical Entry Education Level in 2020
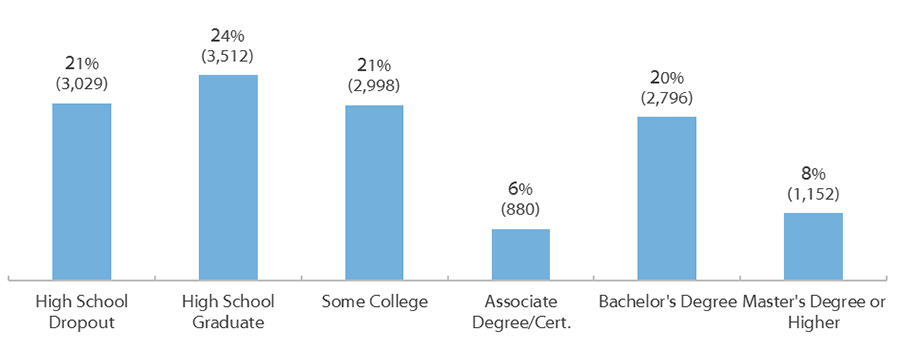
By 2020, approximately 54 percent of jobs in Texas and 65 percent of jobs nationally will require some kind of formal training or education beyond high school. Between 2010 and 2020, approximately 62 percent of all job openings in Texas will require some postsecondary education, and around 36 percent of those positions will require the attainment of a degree or certificate.
For employees without any postsecondary education, most job openings by 2020 will come from the food service, personal service, and blue-collar occupations, such as construction, production, and transportation. Openings that generally require postsecondary education will be concentrated in sales and office support, healthcare, education, and managerial roles, which, along with food/personal services, will also be the fastest growth occupations.
Source: Georgetown University Center on Education and the Workforce, Recovery: Job Growth and Education Requirements Through 2020, June 2013 (http://cew.georgetown.edu/recovery2020/states/).
People Without Health Insurance, by State (2016)
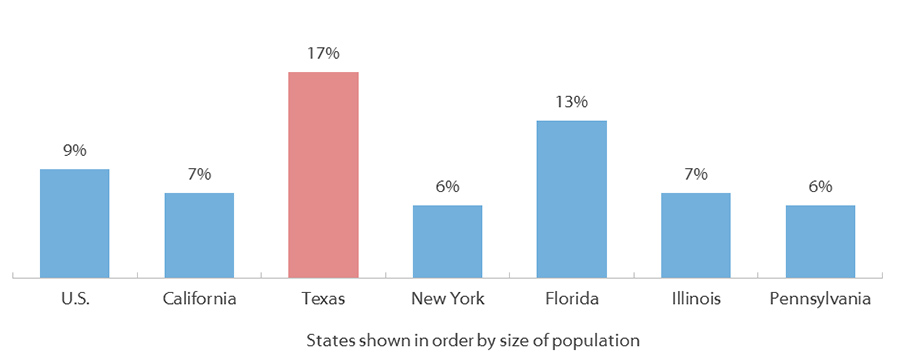
About nine percent of Americans lacked health insurance in 2016. The percentage is much higher in Texas. At 17 percent, Texas is almost twice the national average. It has the highest percentage of any state, with Alaska coming in second at 14 percent.
If a college student or family member were to become ill and did not have health insurance, it could be financially devastating and cause the student to drop out of college.
Source: U.S. Census Bureau, “Health Insurance Coverage in the United States: 2016” (https://www.census.gov/content/dam/Census/library/publications/2017/demo/p60-260.pdf).
People in Poverty, States with Highest Rates (2016)
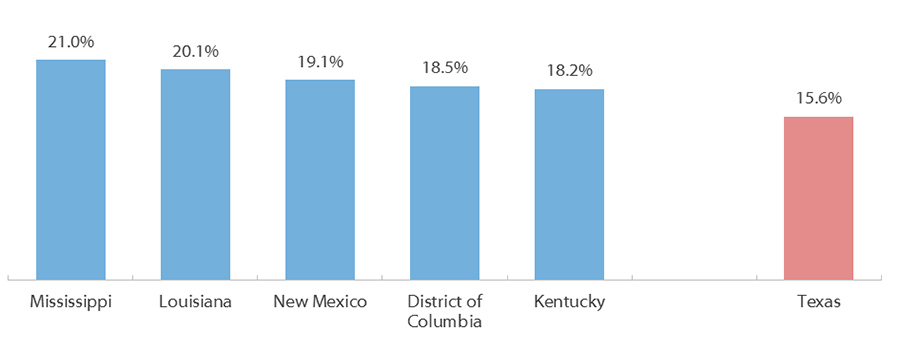
An average of 14 percent of people in the U.S. lived in poverty in 2016, up from 13.5 percent in 2015. Texas has the fourteenth highest poverty rate in the nation and a poverty rate higher than the national average. In 2016, 15.6 percent of Texans lived below the poverty line, down from 15.9 percent in 2015. In 2016, poverty was defined as having an income of $24,339 or less for a family of four with two children, or $12,486 or less for an individual under 65 years old.
People in Poverty, Largest States (2016)
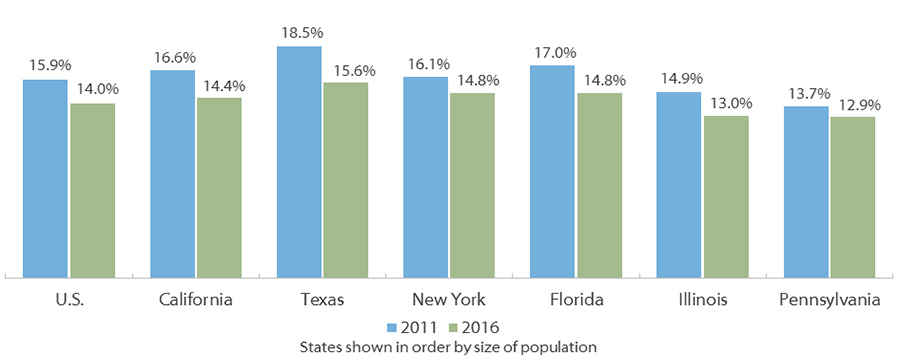
At 15.6 percent, Texas continues to have the highest poverty rate among the six largest states, followed by Florida and New York, at 14.8 percent. All of the six largest states and the nation overall saw a decrease in poverty rate between 2011 and 2016.
Sources: Poverty Rates: U.S. Census Bureau, “Percentage of People in Poverty by State Using 2- and 3-Year Averages: 2011-2012 and 2015-2016” (http://www.census.gov/topics/income-poverty/poverty.html); Definition of Poverty: U.S. Census Bureau, “Poverty Thresholds: 2016” (https://www.census.gov/data/tables/time-series/demo/income-poverty/historical-poverty-thresholds.html)
Poverty Rate by Region (2016)
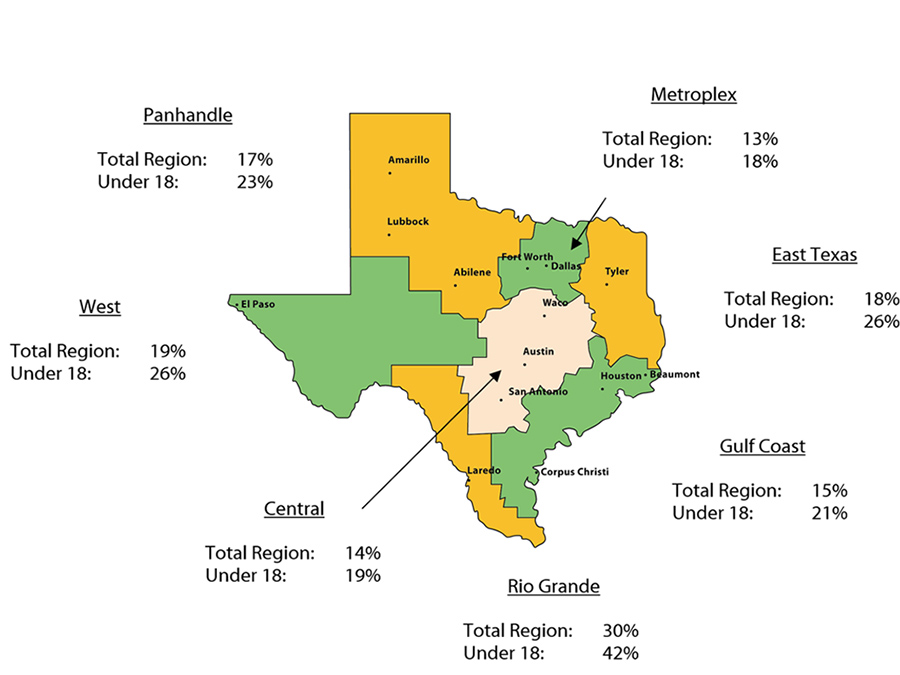
The 2016 poverty rates in Texas were 16 percent overall and 22 percent for children under 18; however, these rates vary widely by region. By a large margin, the Rio Grande region has the highest rates of overall and childhood poverty at 30 and 42 percent respectively – at least 11 percentage points higher than the next highest region. The Metroplex region had the lowest rates of poverty at 13 percent overall and 18 percent for those under 18.
In 2016, poverty was defined as having an income of $24,339 or less for a family of four with two children, or $12,486 or less for an individual under 65 years old.