State of Student Aid in Texas – 2021
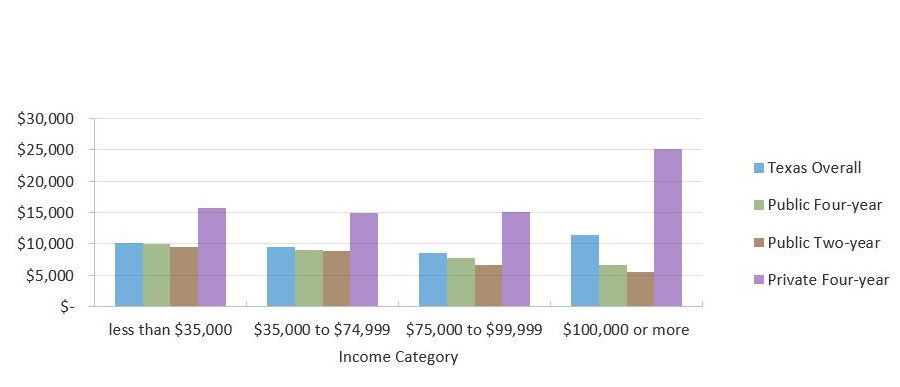
Unmet Need for Low-Income Students in Texas Now Over $10,000
Average Unmet Need for Students in Texas by Income Category and Sector (Fall 2018)
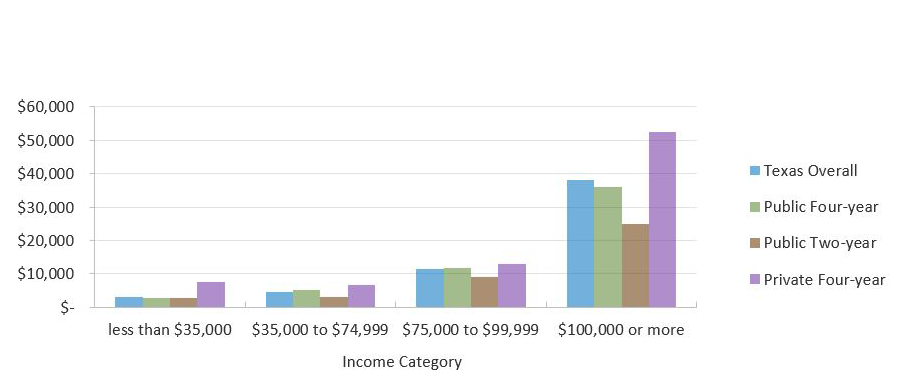
Average EFC for Students in Texas by Income Category and Sector (Fall 2016)
* Estimated sum of tuition and fees, books and supplies, food and housing, transportation, and other expenses for a full-time student for nine months.
** EFC is determined through a federal formula that considers family size, income, and the number of children in college, among other factors. It is considered a rough estimate of a reasonable, affordable annual payment for a family with a given set of circumstances.
Sources: Texas Higher Education Coordinating Board (THECB), “Unmet Need and Expected Family Contribution” (unpublished tables).
Unmet Need Among Community College Students Exceeds Expected Family Contribution
Average Unmet Need and Average EFC* by Race/Ethnicity for Texas Public Institutions (Fall 2018)
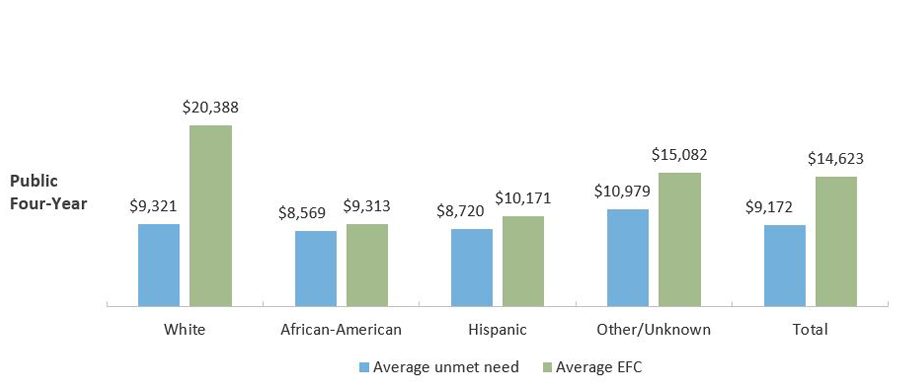
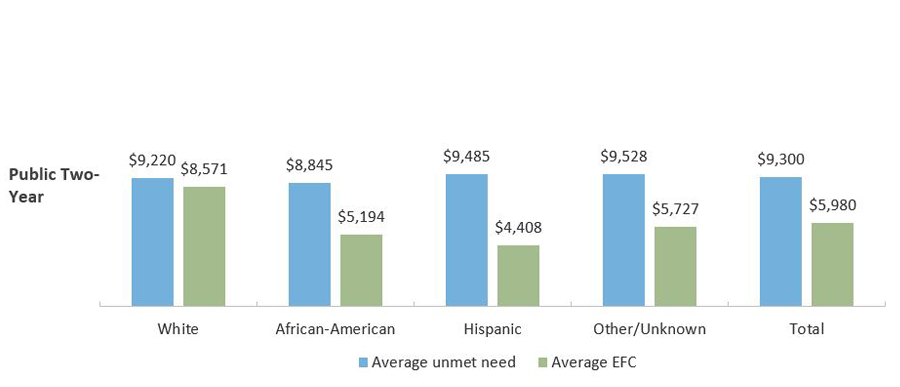
* “Unmet need” is the gap that remains between a student’s resources and his/her total cost of attendance even after accounting for grant aid, loan aid, and EFC.
**EFC is the formulaically determined amount that the student can reasonably be expected to pay out of pocket.
Sources: Texas Higher Education Coordinating Board (THECB), “Unmet Need and Unexpected Family Contribution” (unpublished tables).
Texas Students With Unmet Need Were Less Likely to Graduate Than Those With No Unmet Need
Graduation Status by Unmet Need Amount, 2012-2013 Public Texas High School Graduates Enrolled in Fall 2014 in Texas Higher Education
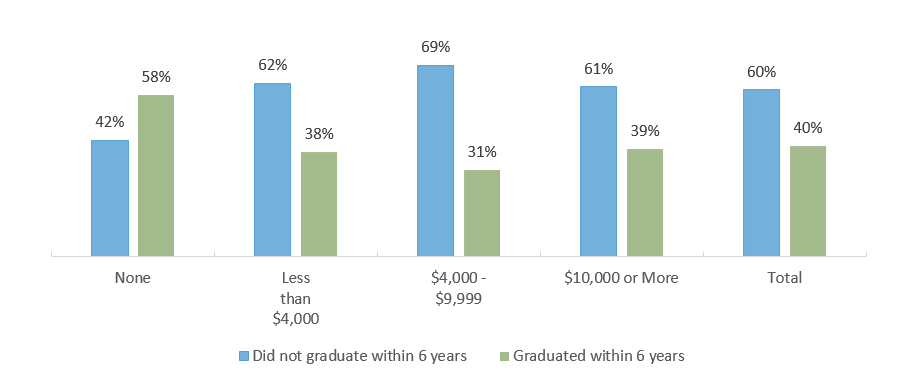
Sources: Texas Higher Education Coordinating Board (THECB), “Baccalaureate Graduation Status within Six Years by Unmet Need” (unpublished tables; special request).
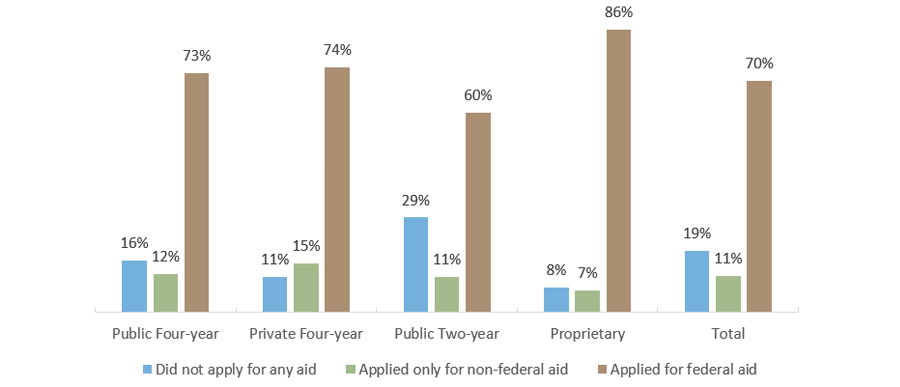
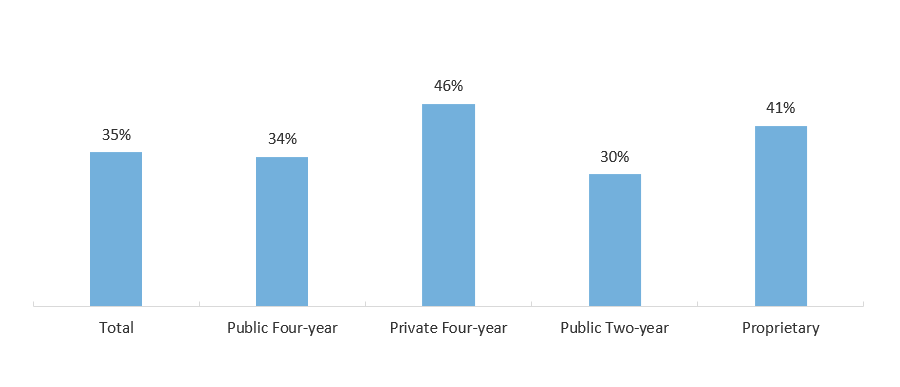
Nearly One-Third of U.S. Undergraduates Who Did Not Apply for Financial Aid Were Wary of Taking On Debt
Applied for Any Aid, by Sector (in AY 2015-2016)
Reasons For Not Applying for Financial Aid, (in AY 2015-2016)
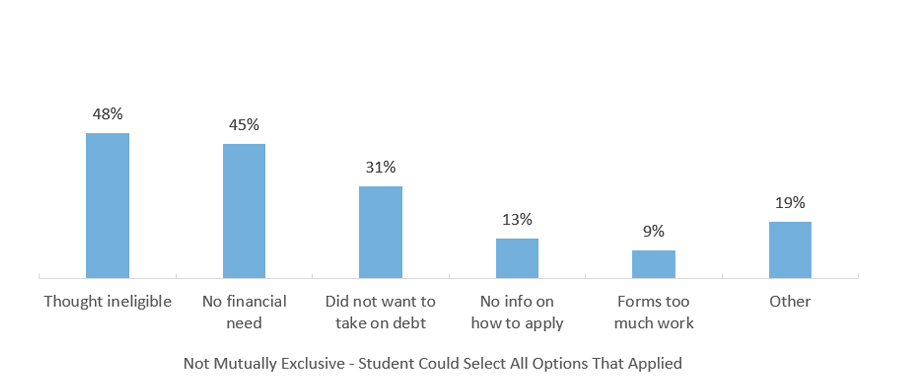
Sources: U.S. Department of Education, National Postsecondary Student Aid Study (NPSAS) 2016 (http://www.nces.ed.gov/das).
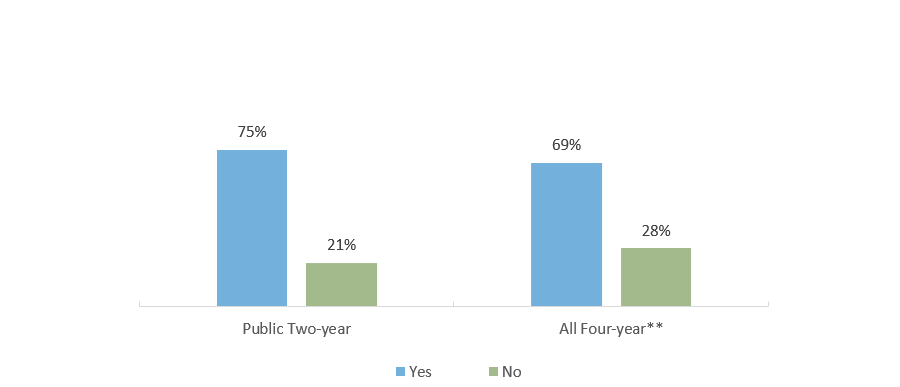
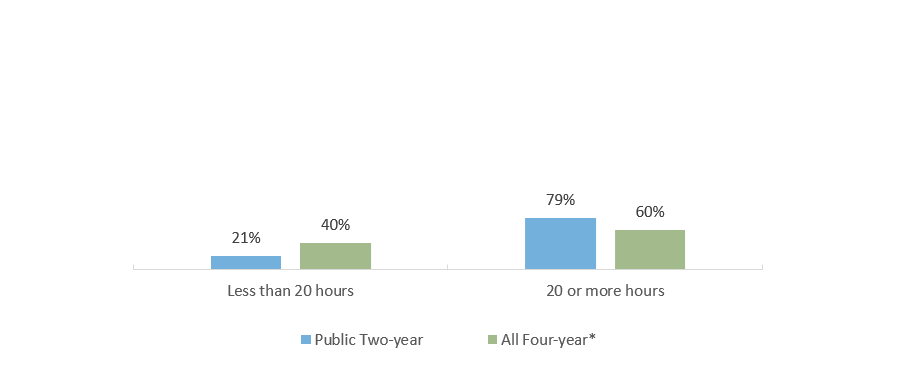
Two-Thirds of Community College Students Nationally Worked While Enrolled
Hours Worked* per Week by Sector (AY 2015-2016)
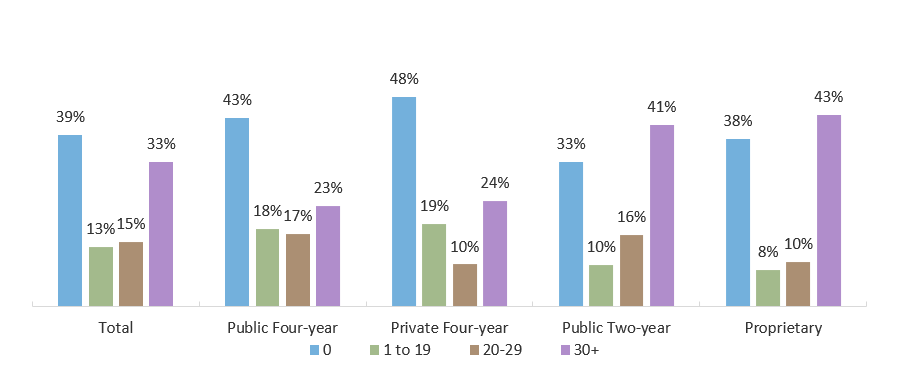
Percentage Working Zero Hours per Week by Sector and Enrollment Intensity (AY 2015-2016)
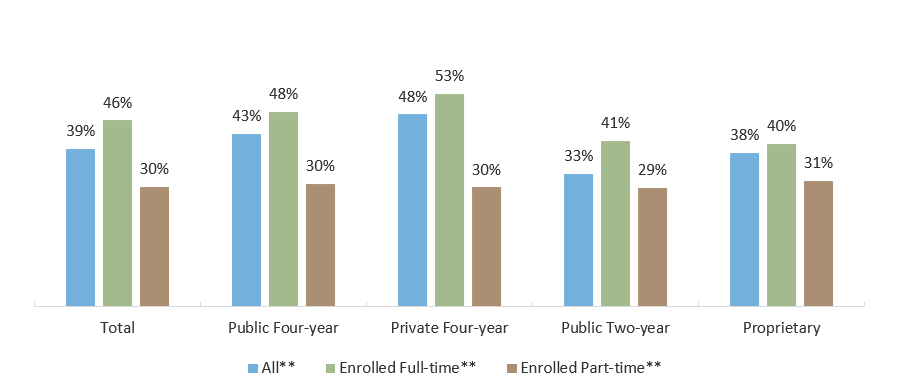
*Excludes work-study
**Only those who were enrolled exclusively full-time or exclusively part-time for both the fall 2015 and spring 2016 semesters.
Sources: U.S. Department of Education, National Postsecondary Student Aid Study (NPSAS) (http://www.nces.ed.gov/das), 2016.
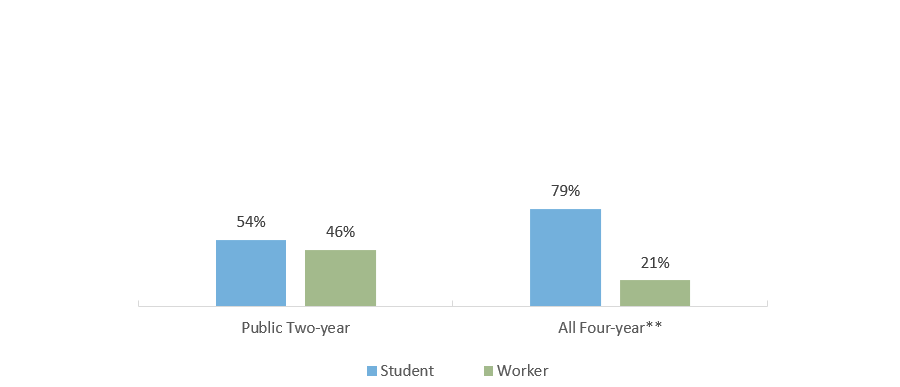
Most U.S. Students Who Work While Enrolled Consider Themselves to Be Students Rather Than Employees
Considers Self as a Student Working to Meet Expenses (AY 2015-2016)
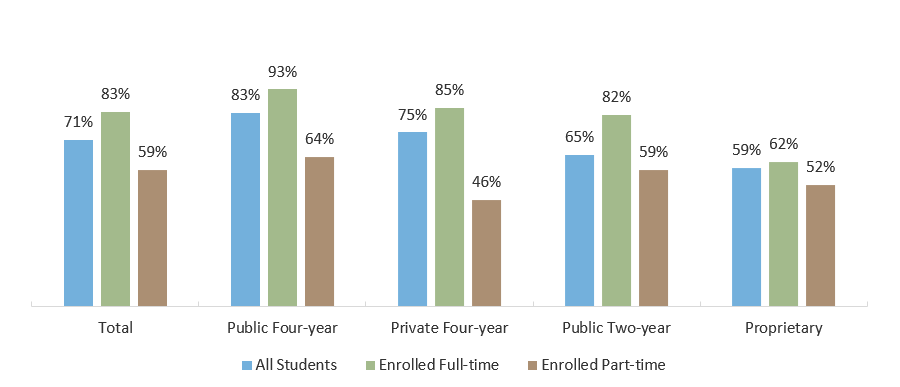
*Only students with jobs (includes work-study).
Sources: U.S. Department of Education, National Postsecondary Student Aid Study (NPSAS) (http://www.nces.ed.gov/das), 2016.
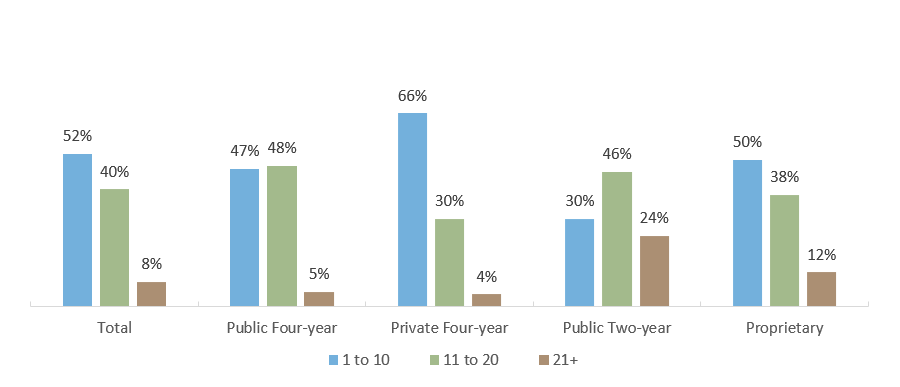
Most U.S. Students Feel Their Work-Study Job Is Not Related to Their Major
Work Study Job Hours Worked per Week, by Sector (AY 2015-2016)
Employed Students: Job Related to Major or Field of Study, by Sector (AY 2015-2016)
*Only students with jobs (includes work-study).
Sources: U.S. Department of Education, National Postsecondary Student Aid Study (NPSAS) (http://www.nces.ed.gov/das), 2016.
Three-Quarters of Public Two-Year Students Worked While Enrolled During the Fall 2019 Semester
Q29: Do you work for pay?*
Q129: Do you consider yourself a student who works or a worker that goes to school? (of respondents who reported they work for pay)
Note: Trellis’ Student Financial Wellness Survey is open to any college nationwide that wants to participate. In the fall 2019 implementation, 78 colleges from 20 states participated – 54 community colleges and 24 four-year institutions. There were 23,684 respondents attending public two-year institutions and 14,804 respondents attending four-year institutions. The results are not nationally representative.
*Responses indicating “I Don’t Know” are not shown
**Includes Public and Private, non-profit institutions
Sources: Klepfer, K., Cornett, A., Fletcher, C., & Webster, J. Student Financial Wellness Survey: Fall 2019 (unpublished tables).
Community College Students Are More Likely to Work 20 or More Hours per Week
Q130: During the school year, about how many hours do you spend in a typical 7-day week working for pay?
Q131-134: If your work hours have changed in the past year, what was the main reason? (check all that apply)**
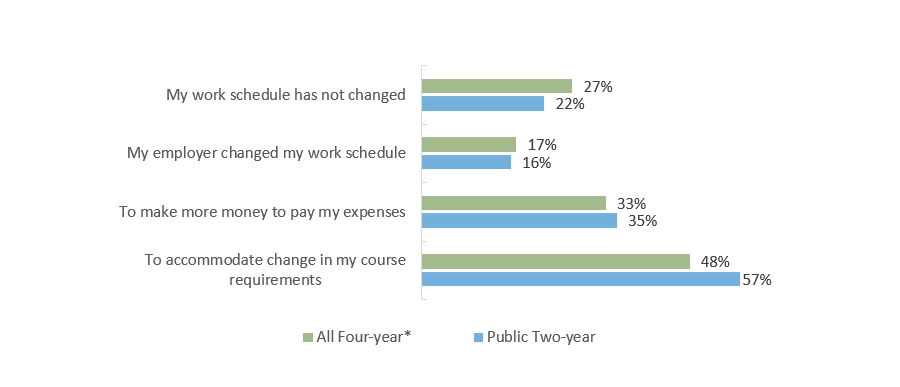
Note: Trellis’ Student Financial Wellness Survey is open to any college nationwide that wants to participate. In the fall 2019 implementation, 78 colleges from 20 states participated – 54 community colleges and 24 four-year institutions. There were 23,684 respondents attending public two-year institutions and 14,804 respondents attending four-year institutions. The results are not nationally representative.
* Includes Public and Private, non-profit institutions
**Percentage indicates respondents who chose at least one of the above choices
Sources: Klepfer, K., Cornett, A., Fletcher, C., & Webster, J. Student Financial Wellness Survey: Fall 2019 (unpublished tables).
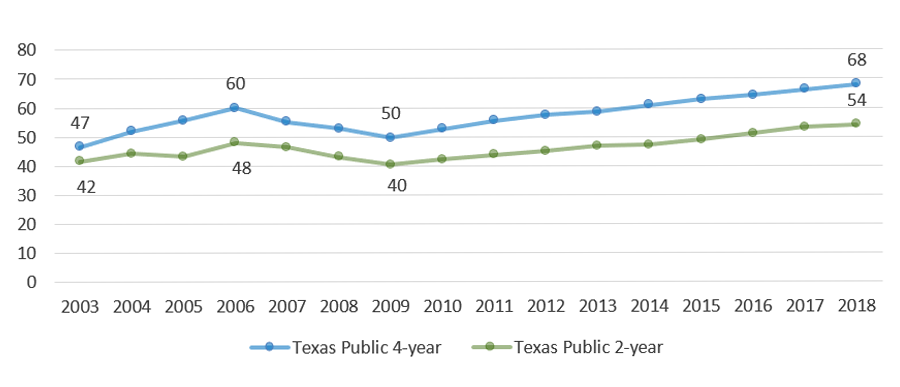
Paying for A Bachelor’s Degree Through Work Alone Would Require 68 Hours per Week at Minimum Wage
Hours of Minimum Wage Work per Week Needed to Pay for an Average Undergraduate Education in Texas, by Sector (2003 to 2018)