State of Student Aid in Texas – 2022
Section 1: Texas Demographics
- Texas’ Future Depends on Addressing Educational Equity
- Texas Poverty Rate Increases, is Higher Than National Average
- Texas Poverty Rates Vary Widely by Region
- Income Needed For Self Sufficiency Varies Considerably by Family Composition
- Lack of Health Insurance Destabilizes Finances, Makes College-Going Precarious
Texas’ Future Depends on Addressing Educational Equity
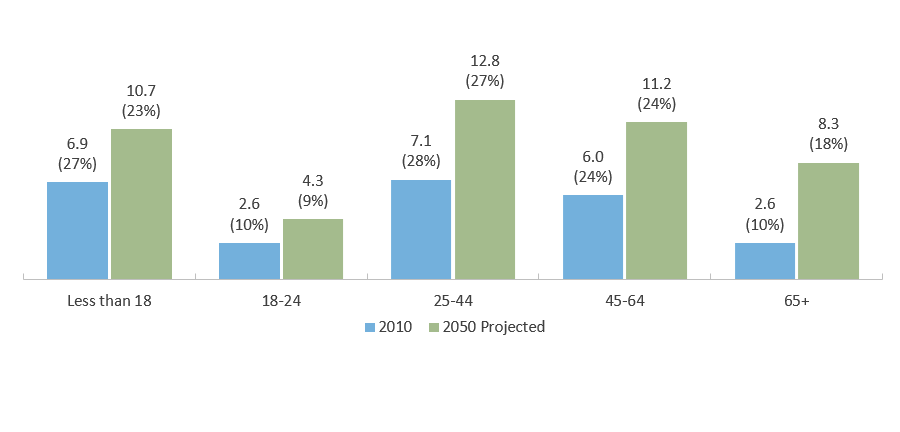
Texas Population by Age in Millions and Percentage of Total in Each Year: 2010 and 2050 (Projected)
Projected* 2050 Population by Age and Ethnicity in Texas
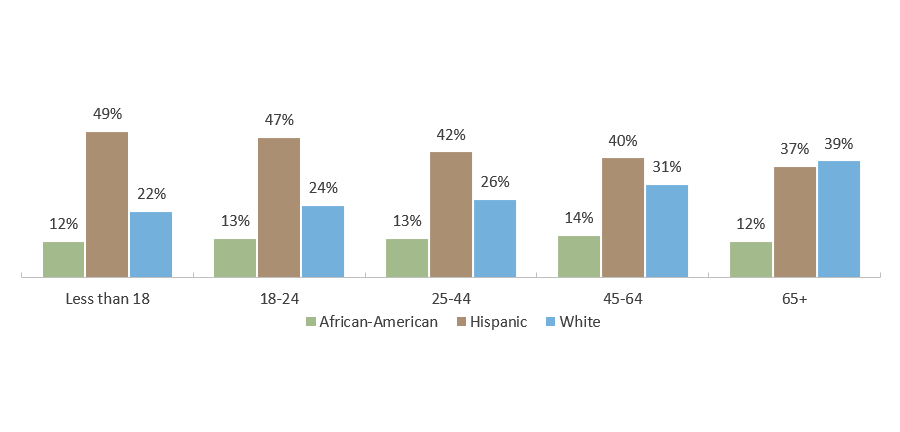
Source: Texas Demographic Center, “Texas Population Projections Program: 2018 Population Projections”, Population Projections for State of Texas by Age Group (https://demographics.texas.gov/Data/TPEPP/Projections/).
Texas Poverty Rate Increases, is Higher Than National Average
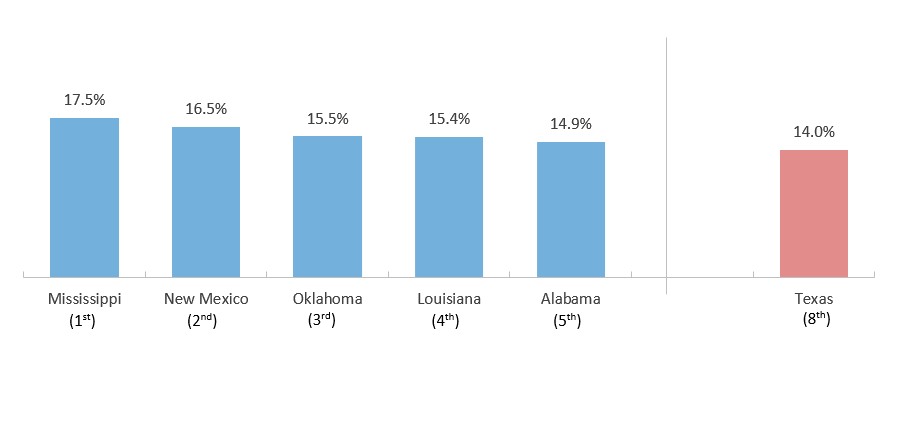
People in Poverty, States with Highest Rates (2020)
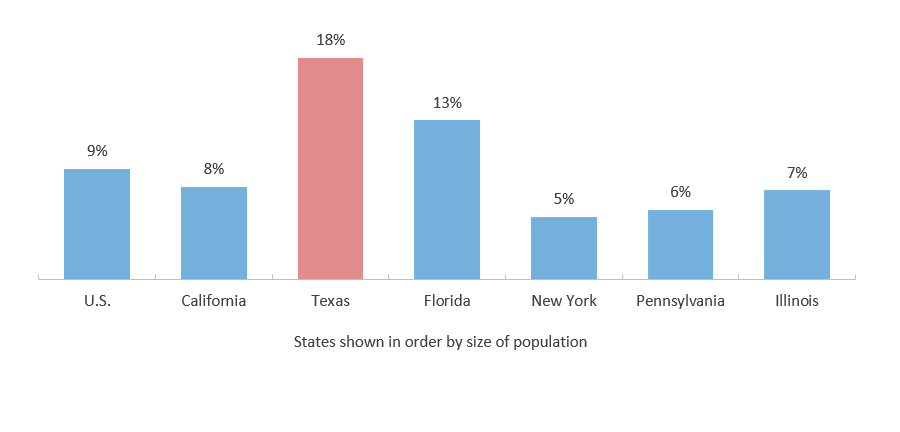
People in Poverty, Largest States (2020)
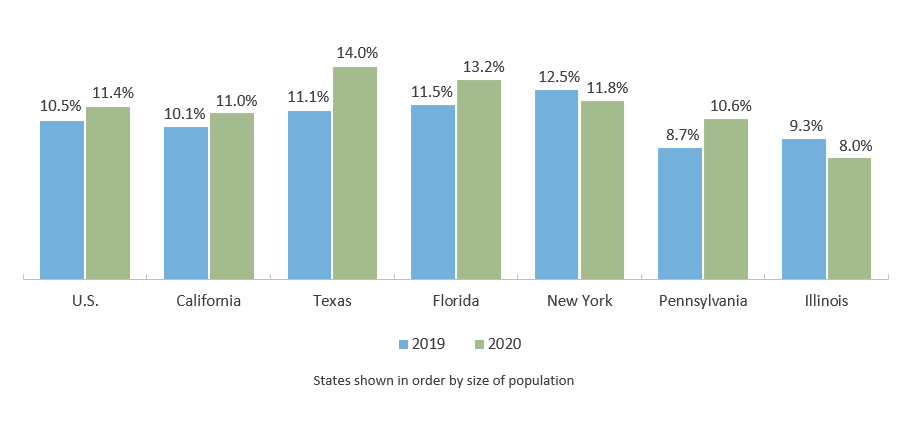
Source: U.S. Census Bureau, “Historical Poverty Tables: People and Families – 1959 to 2020 (https://www.census.gov/data/tables/time-series/demo/income-poverty/historical-poverty-people.html)
Texas Poverty Rates Vary Widely by Region
Poverty Rate by Region (2019)
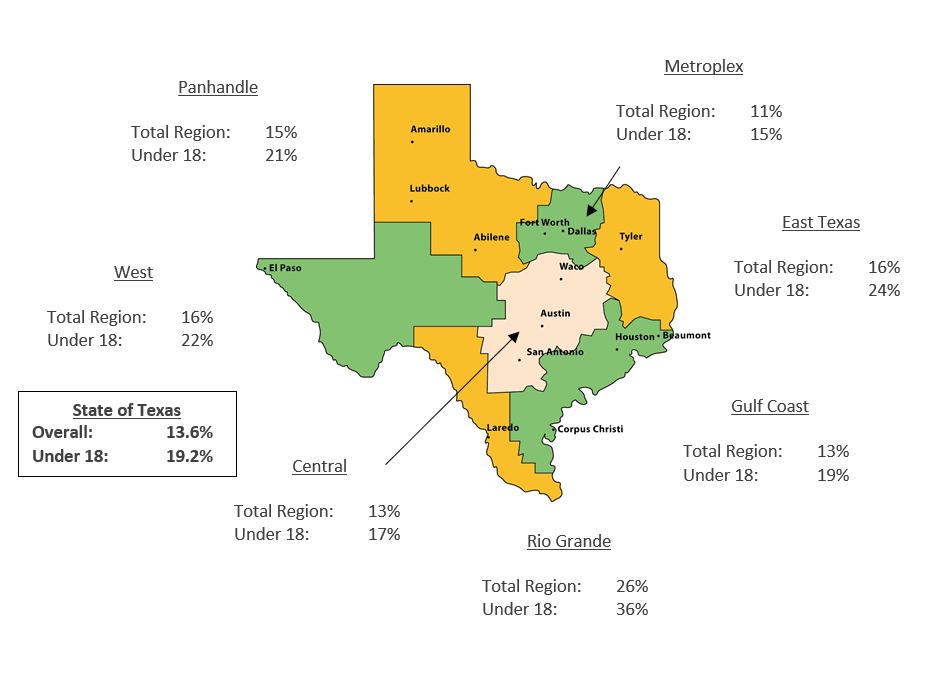
Source: Definition of Poverty: U.S. Census Bureau, “Poverty Thresholds: 2020” (https://www.census.gov/data/tables/time-series/demo/income-poverty/historical-poverty-thresholds.html); Poverty rates by region: U.S. Department of Agriculture, Economic Research Service, “Poverty estimates for the U.S., States, and counties, 2019” (http://www.ers.usda.gov/data-products/county-level-data-sets/download-data.aspx).
Income Needed For Self Sufficiency Varies Considerably by Family Composition
Minimum Annual Salary Needed to be Self Sufficient Without Public or Private Assistance (2021)
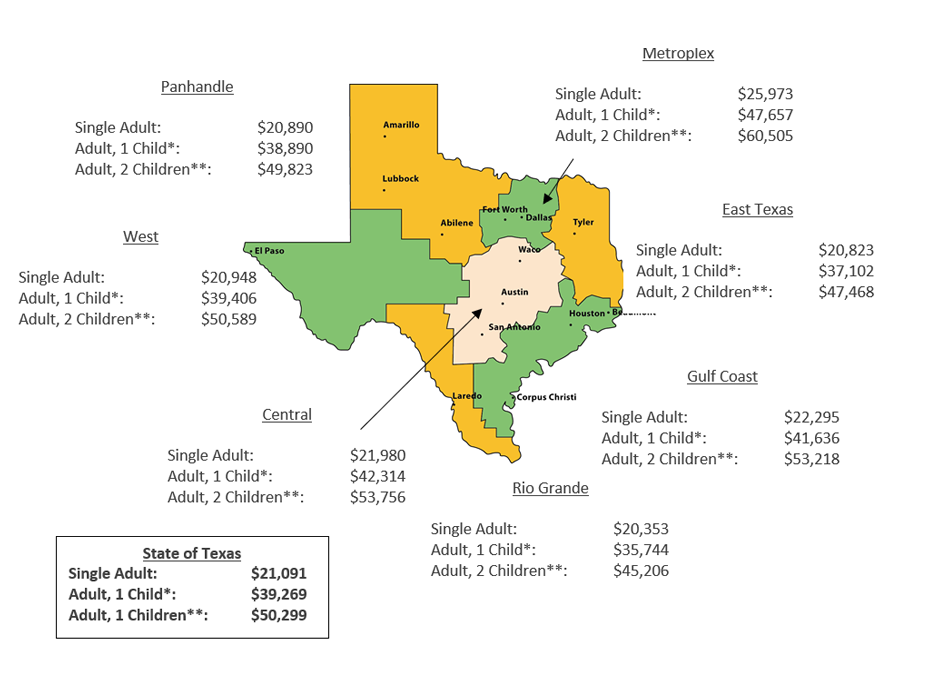
Source: Center for Women’s Welfare, University of Washington School of Social Work, Self Sufficiency Standard (https://selfsufficiencystandard.org/).
Lack of Health Insurance Destabilizes Finances, Makes College-Going Precarious
People Without Health Insurance, Large States (2019)