State of Student Aid in Texas – 2022
Section 7: Need and Work
- Unmet Need for Low-Income Students in Texas Over $10,000
- Unmet Need Among Community College Students Often Exceeds Expected Family Contribution
- Texas Students With Unmet Need Were Less Likely to Graduate Than Those With No Unmet Need
- About Two-thirds of Undergraduates Applied for Federal Aid
- More Than Two-thirds of Public Two-Year Students Worked While Enrolled During the Fall 2021 Semester
- Community College Students Are More Likely to Work 20 or More Hours per Week
- Paying for A Bachelor’s Degree Through Work Alone Would Require 75 Hours per Week at Minimum Wage
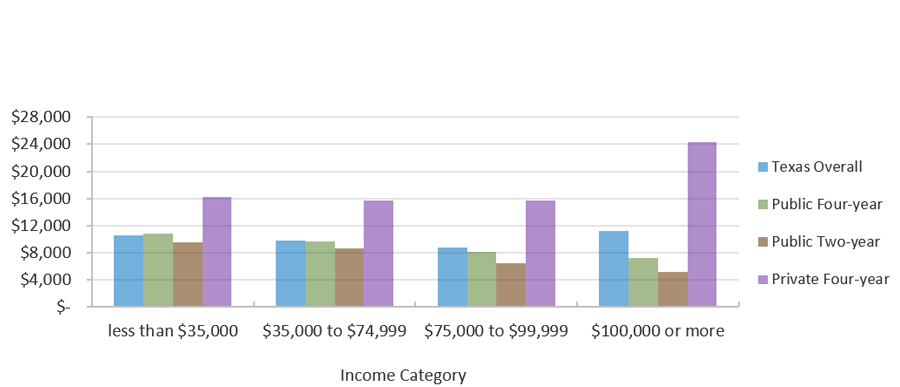
Unmet Need for Low-Income Students in Texas Is Over $10,000
Average Unmet Need for Students in Texas by Income Category and Sector
(Fall 2019)
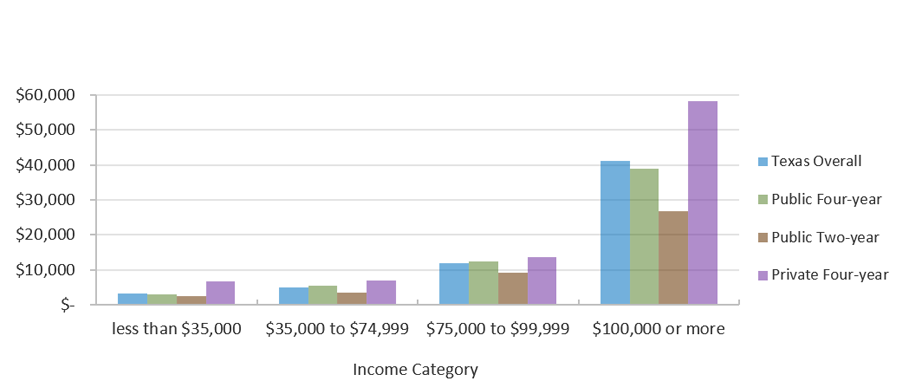
Average EFC for Students in Texas by Income Category and Sector (Fall 2019)
* Estimated sum of tuition and fees, books and supplies, food and housing, transportation, and other expenses for a full-time student for nine months.
** EFC is determined through a federal formula that considers family size, income, and the number of children in college, among other factors. It is considered a rough estimate of a reasonable, affordable annual payment for a family with a given set of circumstances.
Sources: Texas Higher Education Coordinating Board (THECB), “Unmet Need and Expected Family Contribution” (unpublished tables).
Unmet Need Among Community College Students Often Exceeds Expected Family Contribution
Average Unmet Need and Average EFC* by Race/Ethnicity for Texas Public Institutions (Fall 2019)
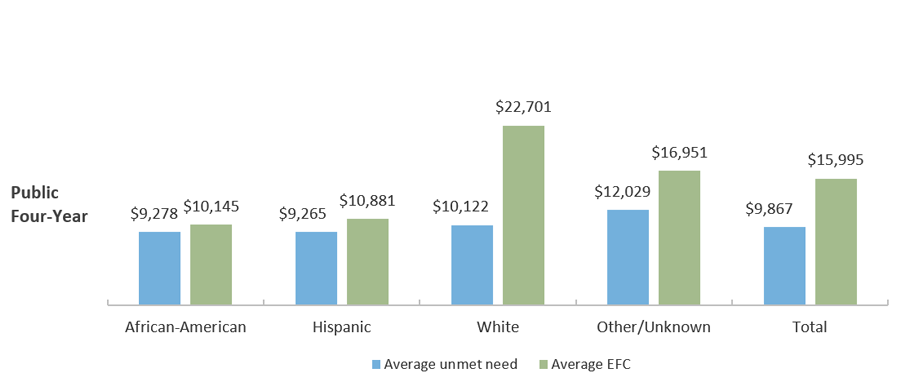
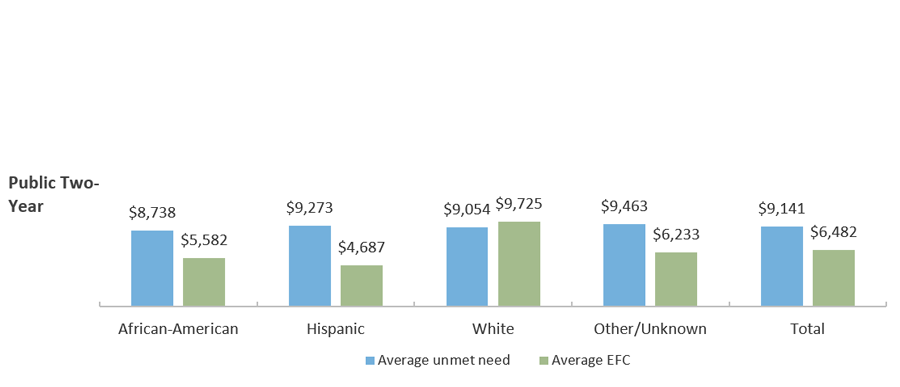
* “Unmet need” is the gap that remains between a student’s resources and his/her total cost of attendance even after accounting for grant aid, loan aid, and EFC.
**EFC is the formulaically determined amount that the student can reasonably be expected to pay out of pocket.
Sources: Texas Higher Education Coordinating Board (THECB), “Unmet Need and Unexpected Family Contribution” (unpublished tables).
Texas Students With Unmet Need Were Less Likely to Graduate Than Those With No Unmet Need
Graduation Status by Unmet Need Amount, 2013-2014 Public Texas High School Graduates Enrolled in Fall 2015 in Texas Higher Education
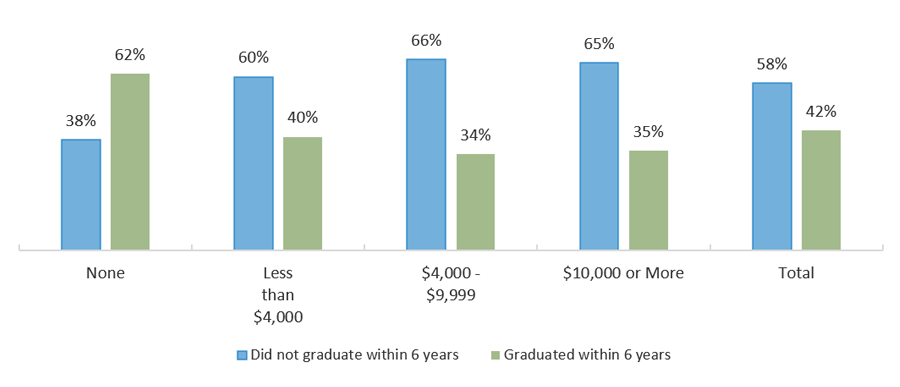
Sources: Texas Higher Education Coordinating Board (THECB), “Baccalaureate Graduation Status within Six Years by Unmet Need” (unpublished tables; special request).
About Two-thirds of Undergraduates Applied for Federal Aid
Applied for Any Aid, by Sector (in AY 2017-2018)
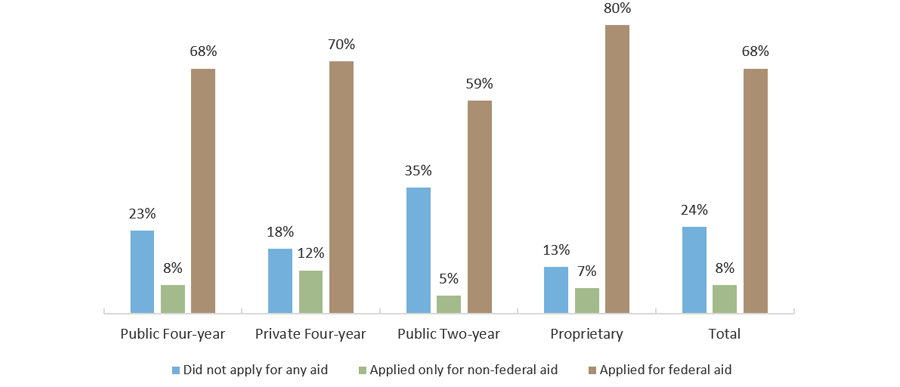
Sources: U.S. Department of Education, National Postsecondary Student Aid Study – Administrative Collection (NPSAS-AC) 2018 (http://www.nces.ed.gov/das).
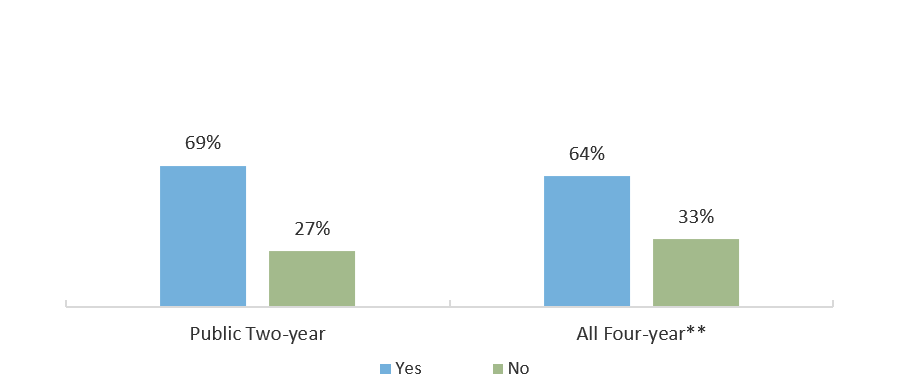
More Than Two-thirds of Public Two-Year Students Worked While Enrolled During the Fall 2021 Semester
Q23: Do you work for pay?*
Q126: Do you consider yourself a student who works or a worker that goes to school? (of respondents who reported they work for pay)
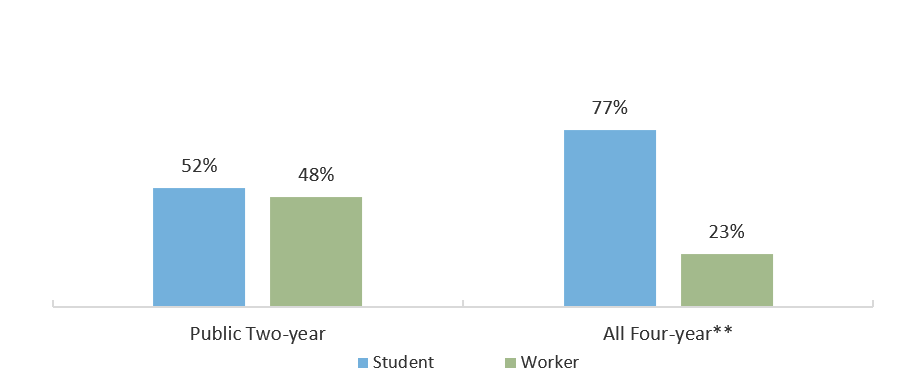
*Responses indicating “I Don’t Know” are not shown
**Includes Public and Private, non-profit institutions
Sources: Fletcher, C., Cornet, A., & Webster, J. Student Financial Wellness Survey: Fall 2021 (unpublished tables).
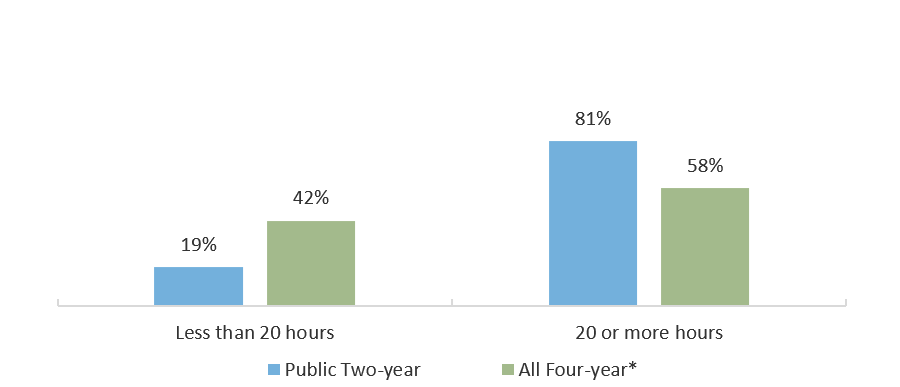
Community College Students Are More Likely to Work 20 or More Hours per Week
Q127: During the school year, about how many hours do you spend in a typical 7-day week working for pay?
Q29: Do you use your current income to pay for college?
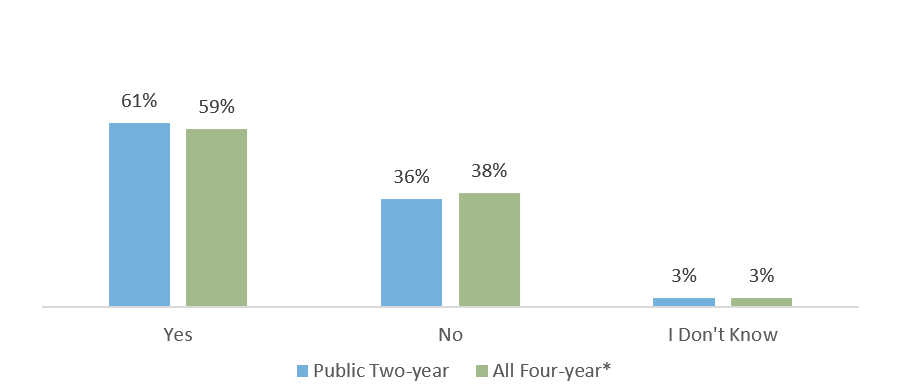
* Includes Public and Private, non-profit institutions
Sources: Fletcher, C., Cornet, A., & Webster, J. Student Financial Wellness Survey: Fall 2021 (unpublished tables).
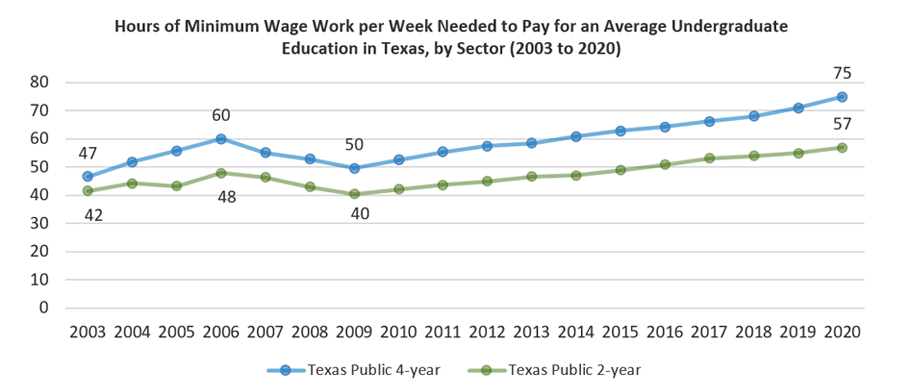
Paying for A Bachelor’s Degree Through Work Alone Would Require 75 Hours per Week at Minimum Wage
Hours of Minimum Wage Work per Week Needed to Pay for an Average Undergraduate Education in Texas, by Sector (2003 to 2020)